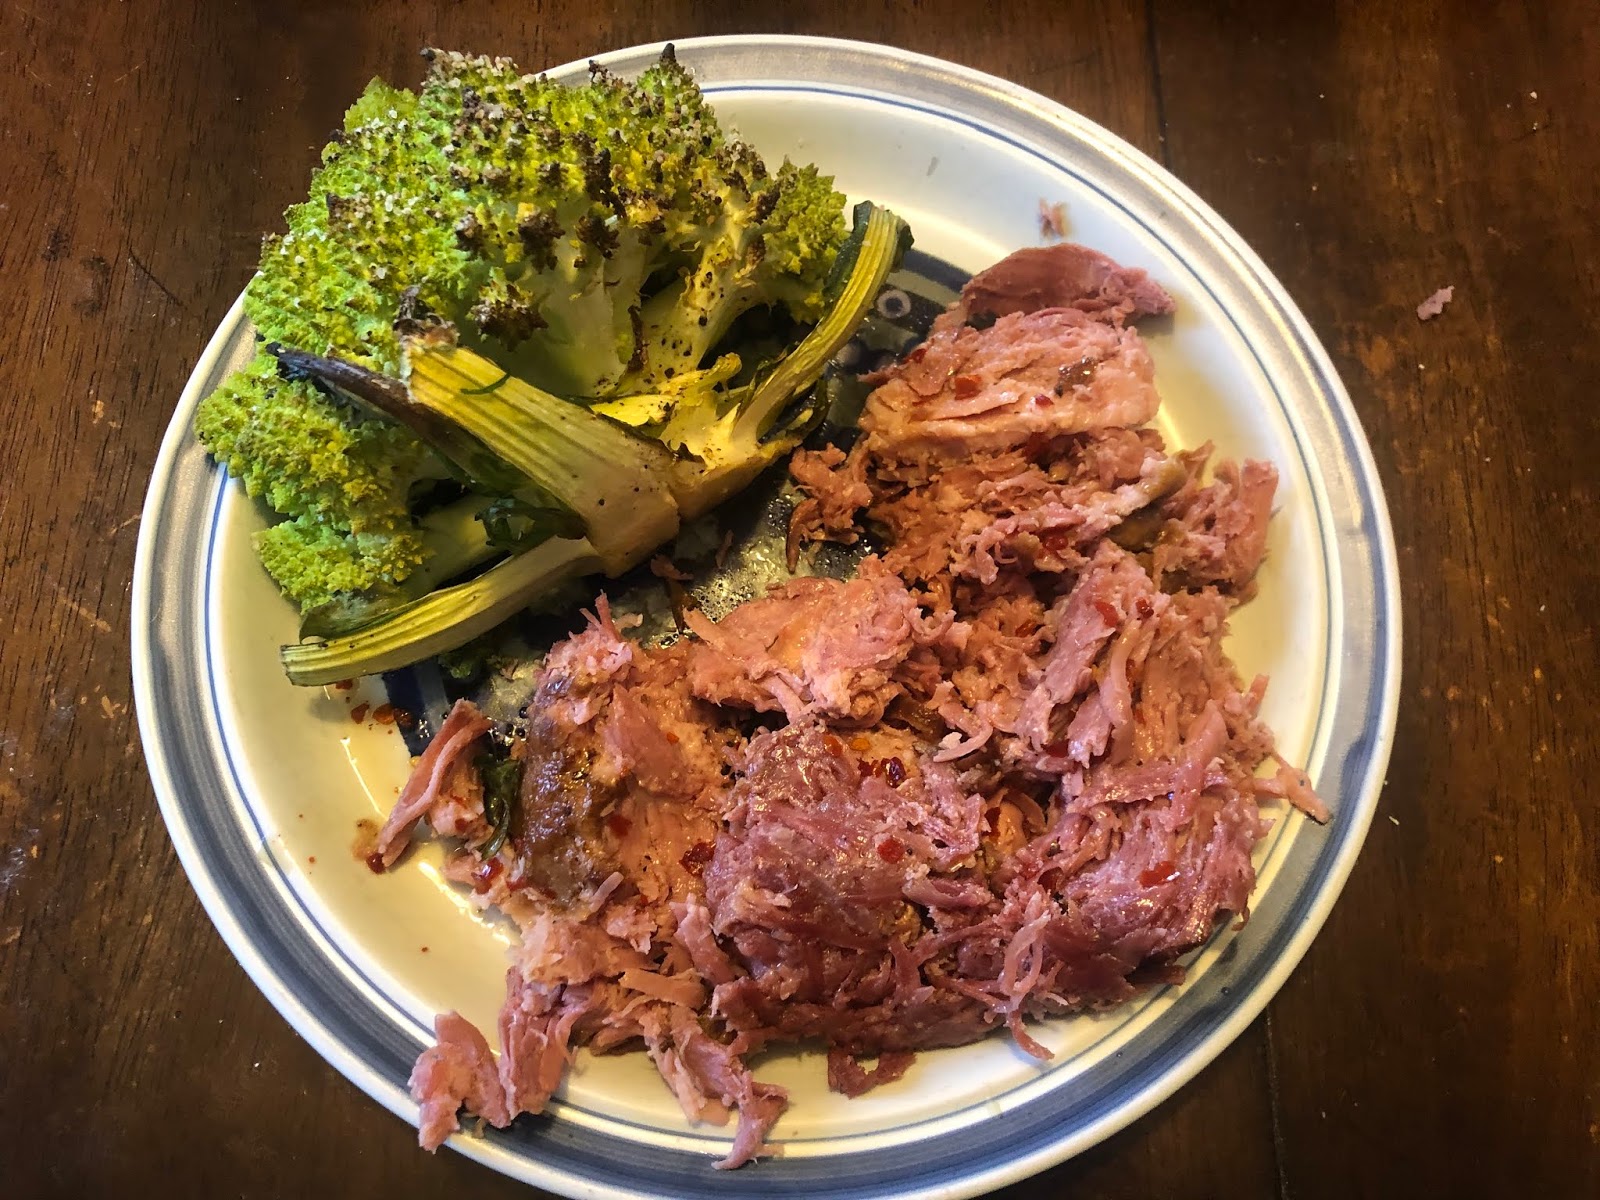
Made this for dinner last night. It was really good and incredibly easy to make, so I thought I’d share.
For the pulled pork, I used Costco smoked pulled pork, but if you wanted to make from scratch, this recipe from Kenji Lopez-Alt is really good (I omit the brown sugar to make it low-carb, but you could also sub with allulose+10 wt% molasses)).
For the sauce, I adapted the recipe from Mastering Sauces, replacing the brown sugar with allulose+10 wt% molasses.
The cauliflower was seasoned with olive oil, salt, and pepper to taste and roasted at 475 °F for 40 min.
The sauce in particular turned out great; a good mix of sour, sweet, and spicy that really brought out the flavor of the pulled pork.
combinations of ingredients (e.g. how much does indigestible fiber, fat, or protein slow carb absorption
When I tried this before, I added ingredients to my normal meals measured the change in my normal BG trends (see Next Experiments). This proved too noisy and I couldn’t get a clean measure of the effect of even pure glucose in a reasonable number of measurements (see Next Experiments).
This time, I have a continuous glucose monitor (Freestyle Libre, post coming soon on accuracy vs. fingerstick and attempts to calibrate it) and am going to try to more carefully isolate the effects of the ingredient being tested.
This is going to be a lot of work and take many weeks, so I was hoping to get some feedback on my experimental design before I start. If you’re interested, please take a look and leave your feedback/critique in the comments.
It’d really improve the experiment to have more people participating. Let me know in the comments or by e-mail if you want to join in (see sidebar).
Proposed Experiment
Note: I put some specific questions at the end
Goals:
Determine effect of individual ingredients on the blood sugar of person with Type 2 diabetes
Determine effect of combining ingredients on same.
Develop model to predict the effect on blood sugar of meals that’s more accurate than standard carb+protein counting
Approach:
Calibrate Instruments: Over several days, measure blood sugar by both CGM (Freestyle Libre) and BGM (Freestyle Lite). Develop a calibration curve to increase accuracy of CGM data
Note: I’m already doing this and initial indication is that ~75% of the discrepancy between the two meters can be accounted for by a simple linear gain + offset error
Establish Baseline: Monitor blood sugar while skipping breakfast & lunch (both food & insulin) to identify a period of time where my blood sugar is stable for a long enough (need at least 2-4 hours).
Will collect data on at least 3 days in which I’m not exercising in the morning (M, W, F)
To reduce potential noise, need to be careful not to overeat or eat late the night before.
Measure Food Effects: For each ingredient or combination of interest, follow the same procedure as in the baseline, but at the selected time, consume a fixed, measured quantity of the ingredient and monitor blood sugar by CGM and BGM (every 30 min.) for 2 hours or until my blood sugar is stable for at least 1 h.
Initial quantity will be selected based on my previous experience of what will raise my blood sugar by ~20 mg/dL.
Based on the initial results, I will test different quantities of the ingredients until I have a dose-response curve with BG increases from 0 to 40 mg/dL or the quantity exceeds what I would reasonably consume in a sitting, whichever is smaller.
Number experiments will be at least 3 per ingredient or combination.
Initial Ingredients to Test:
Glucose tablet – baseline to which everything else will be compared
Dissolved glucose – effect of dissolving an ingredient
Whey protein – effect of protein
Casein protein – effect of protein type
Allulose – my favorite “indigestible” sweetener for baking & ice-cream
Oat-fiber – low-calorie, low-carb flour replacement I use for muffins and cookies
Inulin – used in a lot of low-carb foods
Questions
Current design tests one ingredient at a time. This is a lot simpler and lets me get results for the first ingredients sooner, but does introduce a systematic variation between ingredients (the week). My thought was to mitigate this by re-testing glucose at some frequency to measure week-to-week variation. Do you think this is sufficient or is there a better design?
I’m not planning to repeat quantities of a given ingredient multiple times, but instead vary the quantity. Since the end result of interest is change in BG as a function of quantity, I figured this would be more experimentally efficient. Are there any problems with this approach?
Since experiments will be done on M, W, F, there will be a 1-2 day washout period between ingredients. Is this sufficient or do I need to separate ingredients by week to ensure a two day washout?
Are there any other ingredients you’d like to see me test?
Preheat oven to 275 °F and spray 9″ springform pan with oil of choice.
Combine chocolate and butter in a bowl. Melt in a microwave at 50% power, stirring occasionally, ~4 min. Let cool for 5 min.
Whisk together eggs, erythritol, water, glucomannan, vanilla, and espresso powder. Whisk in in chocolate mixture until smooth and slightly thickened. Filter through fine-mesh strainer into pan, then gently tap pan on counter to remove air bubbles.
Let cake mixture sit for 10 min. to let air bubbles rise to the top. Pop bubbles with a fork, then bake for 45-50 min., until edges are set and center jiggles slightly when shaken.
Let cool for 5 min., then run a paring knife around the sides of the pan. Let cool on a wire rack until barely warm, ~30 min., then cover, poke holes in top, and refrigerate for at least 6 h.
Remove sides of pan and use an offset spatula to separate cake from bottom tray. Let stand at room temperature for 30 min., then serve with whipped cream.
Whipped Cream
Whisk together all ingredients in a stand mixer on medium low for 1 min, then high until stiff peaks form, 1-3 min.
Tried this recipe?Let us know how it was in the comments
Also posted to Reddit in r/diabetes and r/QuantifiedSelf. Check those out if you want to see/participate in the discussion.
A couple weeks ago, u/NeutyBooty posted on how hot showers caused their blood glucose to rise. Lot’s of commenters confirmed the general observation, but for some it appeared to be a CGM artifact, for some it matched their finger-stick meter, and others they see a BG drop.
To figure out what’s really going on, we decided to do a communal self-experiment. Over the past two weeks, 8 Redditor with diabetes have been measuring their blood glucose before and after showering. So far, we have 22 measurements, so I thought it would be useful to post an initial exploratory analysis of the data to see if the wider community had an insights or suggestions.
In the comments, please chime in with any thoughts, additional analyses, or questions. If there’s any graph, calculation, etc. you’d like to see, let me know and I’ll add it. We also need more experimenters, so if your interested, let me know.
Highlights:
Initial indications are that we are seeing a real and consistent increase in BG from hot showers, not a sensor artifact.
So far, we are not seeing a clear person-to-person variation in the effect (more data needed).
There’s some very tentative but interesting trends in the data:
The effect is stronger with lower initial BG
The effect varies with time of day (could easily be a confounding variable here)
In order to get a clear answer on person-to-person variation and to better pull out any correlations, we need more data, especially repeat data from more people. If you’re interested in joining the experiment, let me know.
Details:
Design/Methods
Protocol here. All data was converted into consistent units and put into an excel spreadsheet. From the raw data, I calculated change in BG from start of shower, as well as the largest relative change, and the time until largest relative change (see spreadsheet for calculation details). Visualization was done using Tableau.
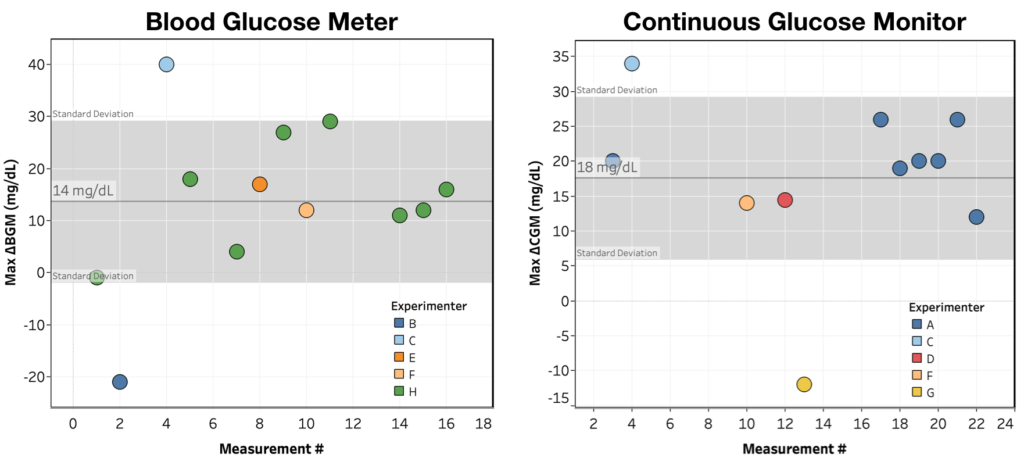
First, let’s look at the big question: are we seeing an effect? For this question, I plotted largest observed change over the 1 hour monitoring period for each shower as measured by both BGM and CGM.
Max ΔBGM & ΔCGM for each shower, colored by experimenter.
Looking at the graphs you can see the following:
We are seeing a measurable rise in blood sugar from a hot shower.
The effect is approximately the same size when measured by BGM vs. CGM, suggesting it’s not a sensor artifact
BIG CAVEAT: We don’t have much data from people with both BGM and CGM, and the majority of data is coming from two experimenters, so this conclusion is very tentative.
We’re not (yet) seeing a clear person-to-person variation. For both BGM and CGM, with the exception of 1 outlier in each case, there’s a pretty consistent increase in BG after a shower.
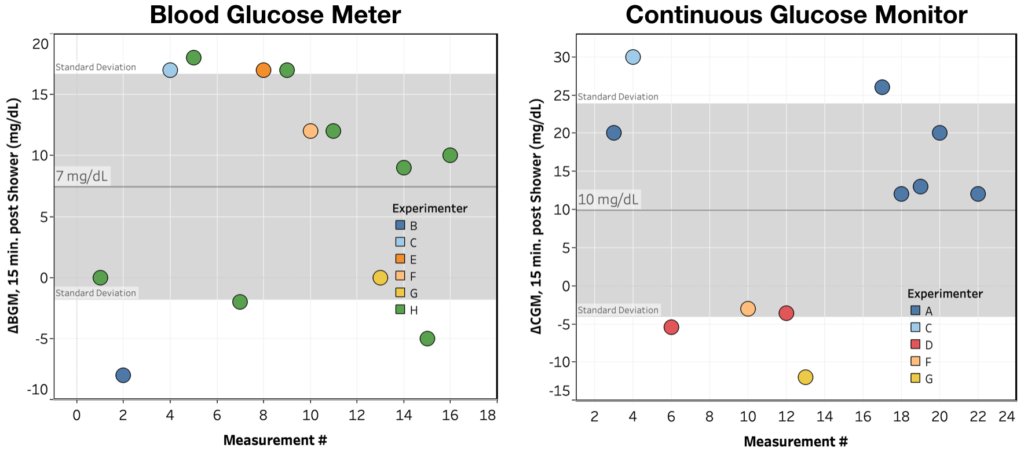
Interestingly, while we consistently see an increase in BG after showering, the timing of that increase is much more variable. If instead of looking at Max ΔBG over the monitoring period, you look at ΔBG 15 minutes after the shower, you get:
ΔBGM & ΔCGM@15 min. for each shower, colored by experimenter.
While we still see the effect, it’s a a lot more variable, especially in the BGM measurements.
Next, even though there’s not enough data for solid conclusions, I thought it’d be interesting to see if there was any interesting patterns/correlations in the data. I looked at:
ΔCGM@15 min. vs. ΔBGM@15 min. – only three data points, so can’t really say anything
Max ΔCGM vs. Max ΔBGM – two data points, can’t say anything
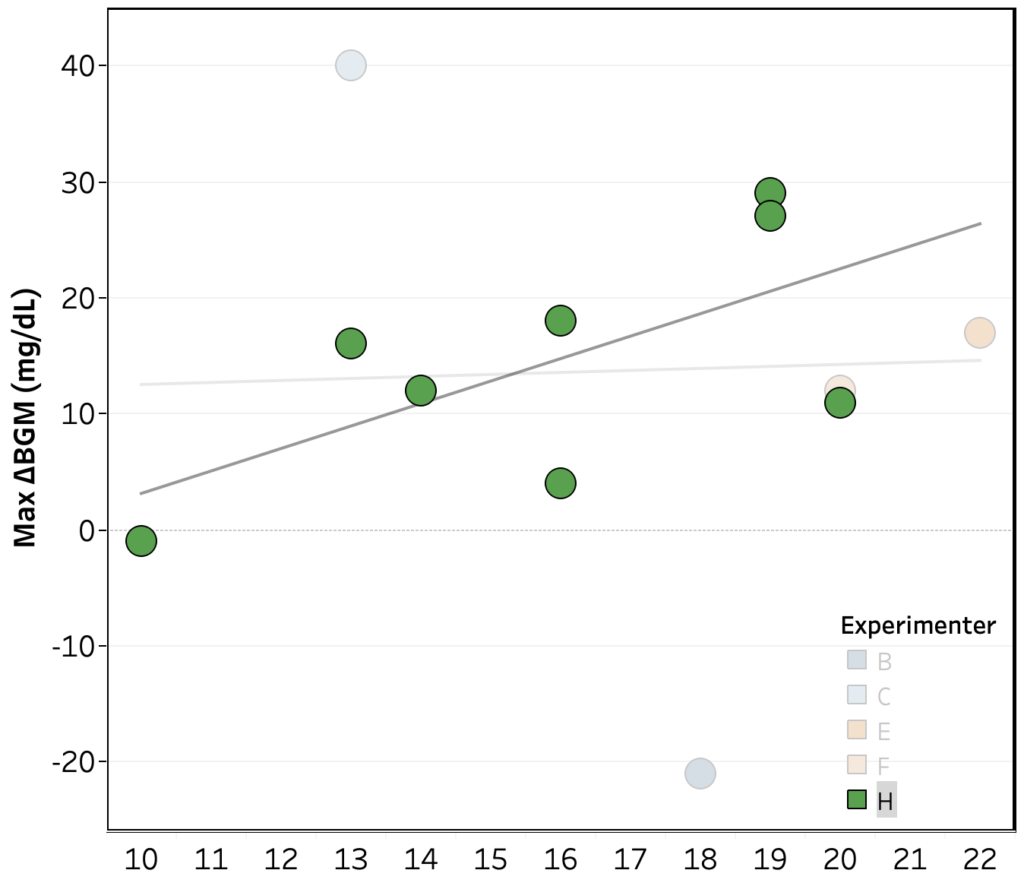
Max ΔBGM vs. hour of the day – no trend across the whole data set, but within Experimenter H’s, there’s an indication of a greater rise later in the day (R2 = 0.40, p = 0.08)
Max ΔCGM vs. hour of the day – no clear trend across the whole data set, nor within experimenters
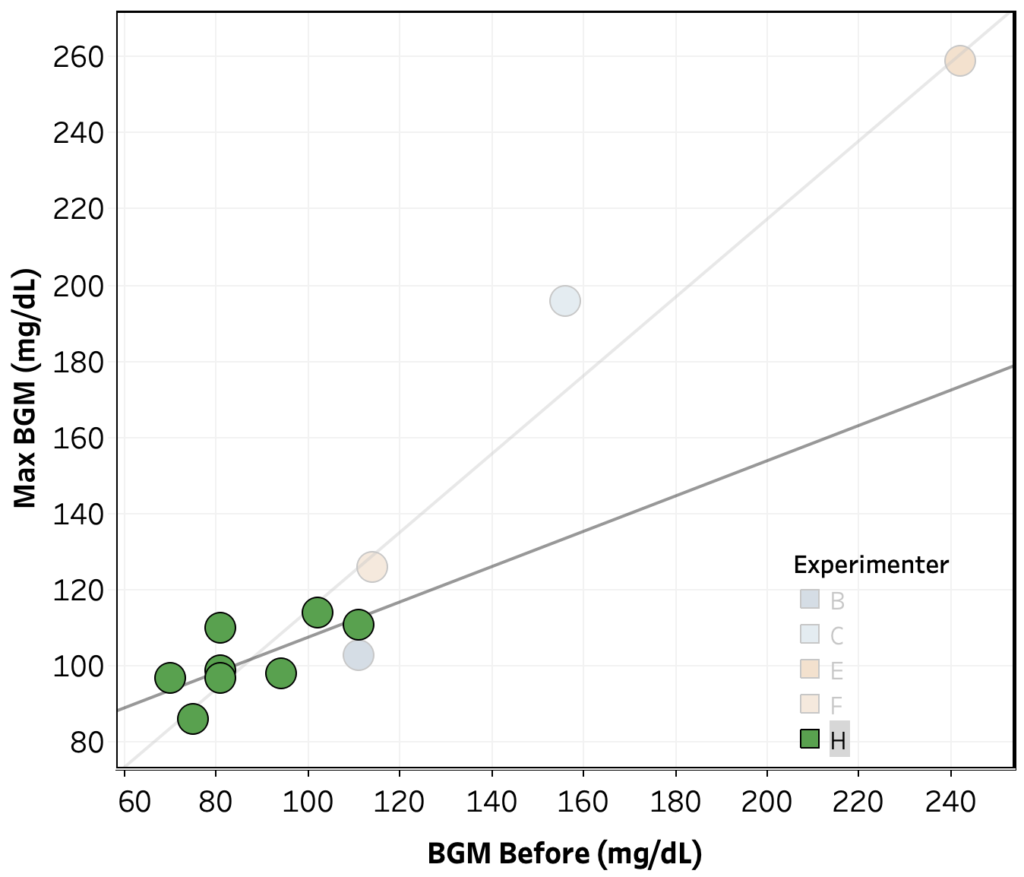
Max ΔBGM vs. starting BGM – no trend across the whole data set, but within Experimenter H’s data, there’s an indication of a strong negative correlation (R2 = 0.57, p = 0.03).
Max ΔCGM vs. starting CGM – no clear trend across the whole data set, nor within experimenters.
Max ΔBGM vs. hour of the day, colored by experimenter. Data from Experimenter H highlighted, showing a clearing increasing trend (R2 = 0.4, p = 0.08)Max ΔBGM vs. initial BGM, colored by experimenter. Data from Experimenter H highlighted, showing a clearing decreasing trend (R2 = 0.57, p = 0.03)