Thanks to the team for all the work they put in figuring out the protocol, running the experiments, and analyzing the data: /u/genetastic and /u/kabong!
Summary
A reader, /u/genetastic, reached out about collaborating on experiments to determine the effect of vinegar on blood glucose after meal consumption.
Like most of you, I had heard all the nigh-magical, pseudoscience claims about using apple cider vinegar to treat diabetes. However, when you dig into the literature, there’s a sizable number of peer-reviewed studies, including several decent meta-analyses, showing that consumption of vinegar with a meal can reduce the blood glucose impact in both diabetic and non-diabetic subjects (see background below for details). There’s also a lot of open questions, including:
Is the effect large enough to matter for practical meals?
What types of meals does vinegar affect?
What is the best protocol to get a large effect without unpleasant side effects?
What’s the underlying mechanism?
Is the effect specific to vinegar or do other acids work?
/u/genetastic, a third collaborator /u/kabong, and I decided to answer these questions with community self-experiment.
For the first phase of this experiment, we wanted to check that we could observe the reported impact of vinegar on blood sugar and that the effect size was large enough to be worth further study.
Towards this end, all three experimenters tested consuming regular white bread with and without apple cider vinegar (the most commonly tested meal and vinegar source in the literature).
Here’s a summary of the results & next steps (full details below):
We observed a similar effect of vinegar on blood glucose as that reported in the literature.
The effect was both statistically significant and meaningful in magnitude, justifying further study of the scope, mechanism, and optimal protocol.
Peak change in blood glucose & iAuC were reduced by 20% and time to peak blood glucose & initial rise were slowed by 15-20 min. (30-50%).
P-values were all <0.05, with the exception of the drop in iAuC, which was 0.12
Next, we will be looking at the following:
Diluting vinegar to make it more palatable
Alternate macronutrients (simple sugars, proteins) to determine scope of the effect
Alternate acid sources to test the amylase-inhibition hypothesis
All-in-all, a good start to the study. The effect seems to be real and likely caused by a slowing of the initial rise/rate of metabolism.
We’re also see a lot of value to running the experiment as a team rather than my more typical N=1 study. With most of my experiments, there’s always a concern that the results are specific to my body chemistry and won’t generalize to others. Having data from multiple people significantly reduces that risk.
That said, having data from multiple participants significantly complicates the analysis. Luckily, /u/genetastic is much better at statistics than I am and was able to handle it.
It would significantly improve the study to have a larger number of participants. If you’re interested in collaborating on this or other scientifically rigorous self-experiments with low-carb foods, supplements, or other health interventions, please let me know in the comments or via the contact form on the right.
About a week ago a reader, /u/genetastic, reached out about collaborating on experiments to determine the effect of vinegar on blood glucose after meal consumption.
Like most of you, I had heard all the nigh-magical, pseudoscience claims about using apple cider vinegar to treat diabetes. However, when you dig into the literature, there’s a sizable number of peer-reviewed studies, including several decent meta-analyses, showing that consumption of vinegar with a meal can reduce the blood glucose impact in both diabetic and non-diabetic subjects (see background below for details). There’s also a lot of open questions, including:
Is the effect large enough to matter for practical meals?
What types of meals does vinegar affect?
What is the best protocol to get a large effect without unpleasant side effects?
What’s the underlying mechanism?
Is the effect specific to vinegar or do other acids work?
/u/genetastic, a third collaborator /u/kabong, and I decided to answer these questions with community self-experiment.
Below, I give more details on the background literature and pre-register our protocol and analyses.
It would significantly improve the study to have a larger number of participants. If you’re interested in collaborating on this or other scientifically rigorous self-experiments with low-carb foods, supplements, or other health interventions, please let me know in the comments or via the contact form on the right.
Details
Purpose
To replicate (or fail to replicate) the existing literature and quantify the effect of vinegar on blood glucose level after consumption of complex carbohydrates.
To better understand the underlying mechanism by determining how this effect varies with person/metabolic status, dose, source of calories, and type of acid.
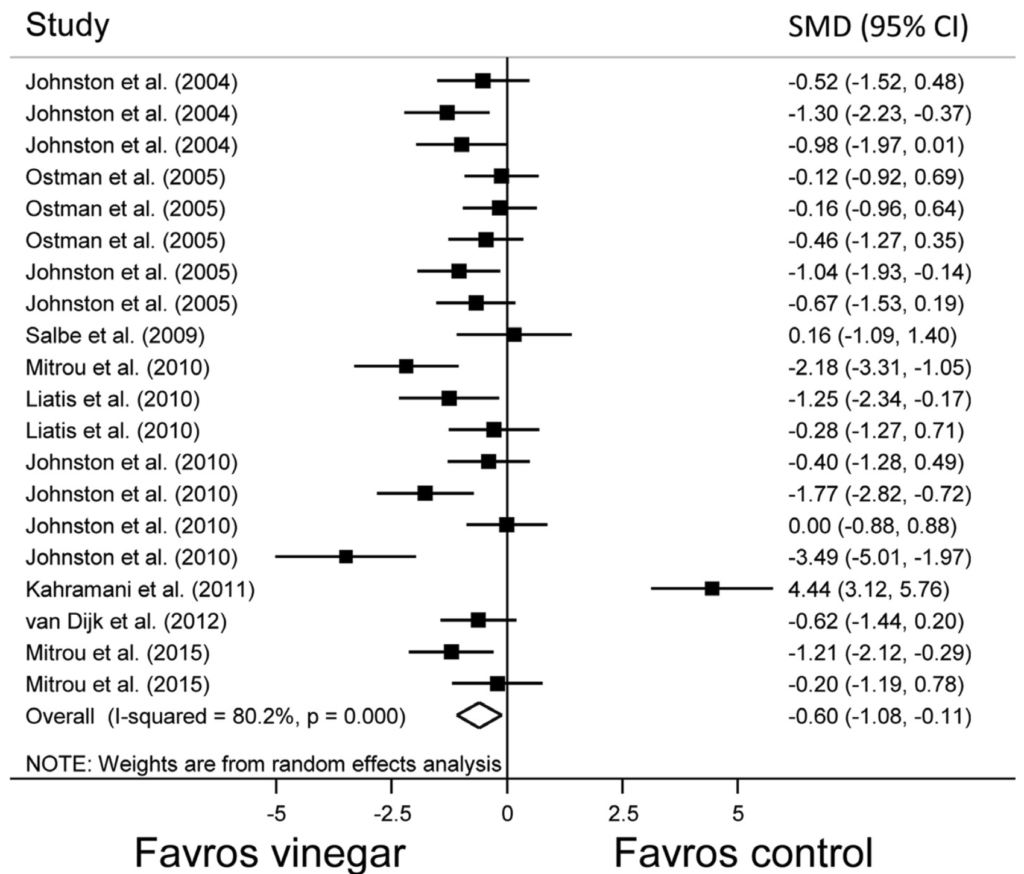
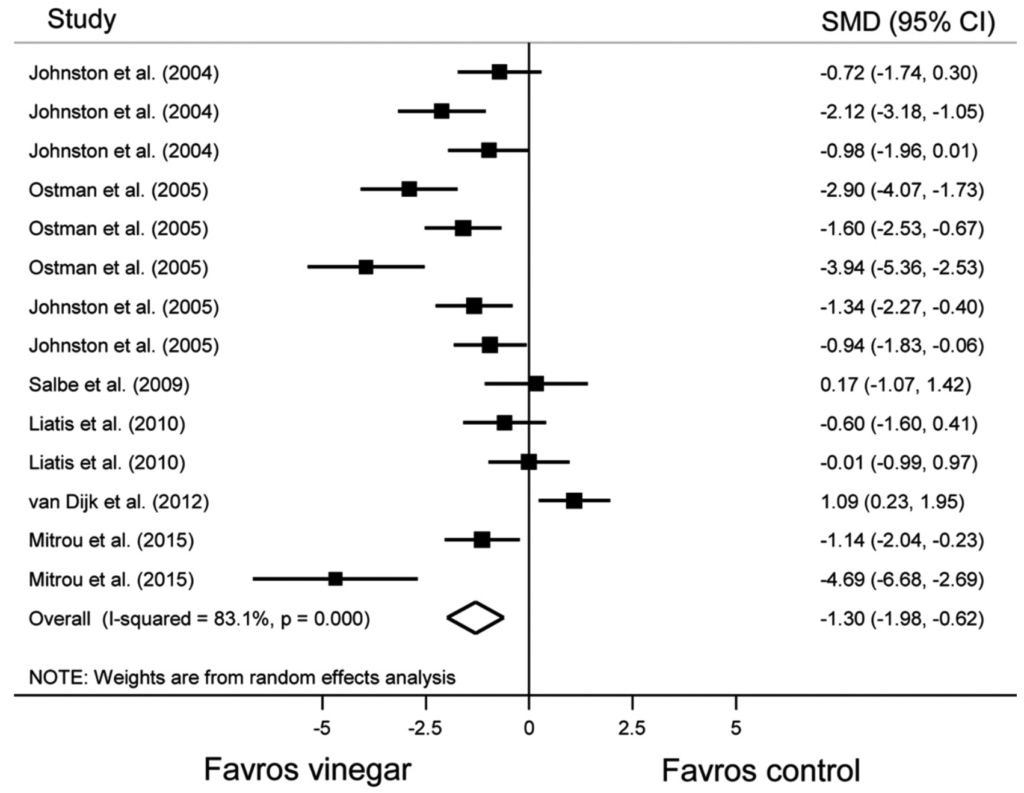
Figure 1. Forest plot showing individual and pooled random effect standard mean difference (95% CI) of trials testing the effect of vinegar on glucose area under the curve. Test of overall effect: z = 2.42, p = 0.01.Figure 2. Forest plot showing individual and pooled random effect standard mean difference (95% CI) of trials testing the effect of vinegar on insulin area under the curve. Test of overall effect: z = 3.73, p < 0.001.
All together this is decent evidence for the acid as inhibitor of alpha-amylase as mechanism hypothesis
One of the biggest challenges in the vinegar/acid literature is that all of the experiments were done with different meals, protocols, and doses, making it difficult to integrate data from multiple studies. To address this issue and answer some of the open questions about this effect, /u/genetastic, /u/kabong, and I decided to do a series of community self-experiments.
While we each have different motivations and interests, overall, the questions we’re looking to answer are:
Is the effect large enough to matter for practical meals?
What types of meals does vinegar affect?
What is the best protocol to get a large effect without unpleasant side effects?
What’s the underlying mechanism?
Is the effect specific to vinegar or do other acids work?
To answer these questions, we will be conducting experiments using the protocol below.
Methods
Materials
Meals:
white bread (starch)
dried dates (simple sugars)
tortilla with beans, salsa, & avocado (starch, fat, and protein)
Vinegar:
Apple cider or white vinegar
As large a quantity as comfortable, not to exceed 30g
Diluted in as little water as tolerable
Blinding
Vinegar supplementation will not be blinded
However, the protocol was established in advance and adhered to without modification once experiments started.
Procedure
Each participant is using a slightly different procedure
This post is the final report on our Community Self-Experiment studying the effect of hot showers on blood glucose. If you don’t want to read all the details, the highlights are in the Background & Summary section immediately below.
To figure out what’s really going on, we decided to do a communal self-experiment. 8 Redditors with diabetes developed an experimental protocol, measured their blood glucose before and after 41 showers using a combination of CGMs and BGMs, and analyzed the results.
Summary of Results
By working together, the team of experimenters was able to learn more and learn faster than any one of us would have been able to on our own. From the data, we were able to answer several of our initial questions:
What is the change in blood glucose after a hot shower under controlled conditions?
From BGM: 12 ± 17 mg/dL
From CGM: 21 ± 15 mg/dL
Is the observed change in blood glucose real or a CGM sensor artifact?
The change is real, not a sensor artifact (change is observed with BGM; CGM measurements are consistent with typical variation between CGM and BGM)
We cannot rule out the difference in effect size between BGM and CGM being due to a sensor artifact, but the data does not provide support for this hypothesis.
Is there significant person-to-person variation in the magnitude or direction of the effect?
The data is consistent with person-to-person variation, but significantly more data and/or more controlled conditions are required to determine if the variation exists and it’s effect size.
Is the change in blood glucose cause by the hot shower?
We can not identify any factors that account for the blood glucose rise other than the shower, but would need significantly more data and/or more controlled conditions to be certain that the shower is the cause.
While we were not able to get firm answers to all of our questions, we did get a measure of the effect size and rule out it being a CGM sensor artifact (the leading hypothesis in the original post). We also learned a lot that will help guide future Community Self-Experiments.
Data Processing. All data was converted into consistent units and put into an excel spreadsheet. From the raw data, I calculated change in BG from start of shower, as well as the largest relative change, and the time until largest relative change (see spreadsheet for calculation details). Visualization was done using Tableau.
What is the change in blood glucose after a hot shower under controlled conditions?
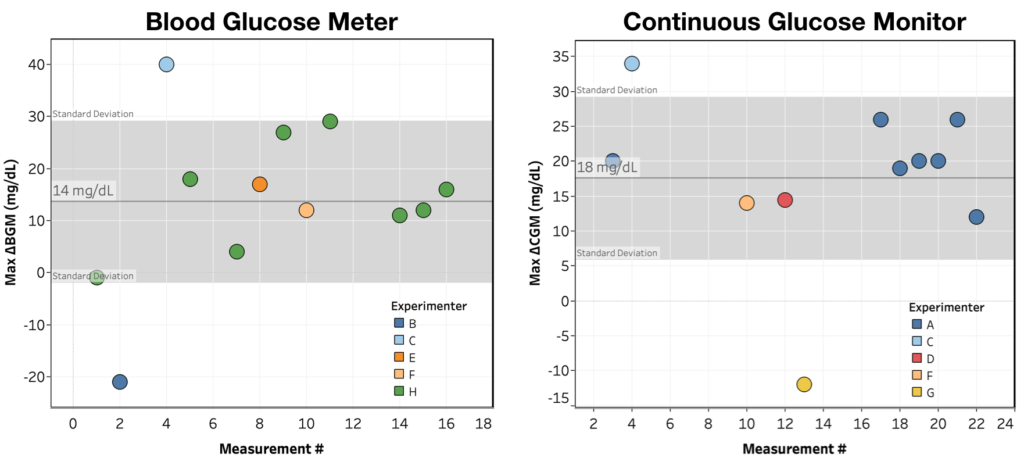
To answer this question, I plotted largest observed change over the 1 hour monitoring period for each shower as measured by both BGM and CGM (see Figure 1).
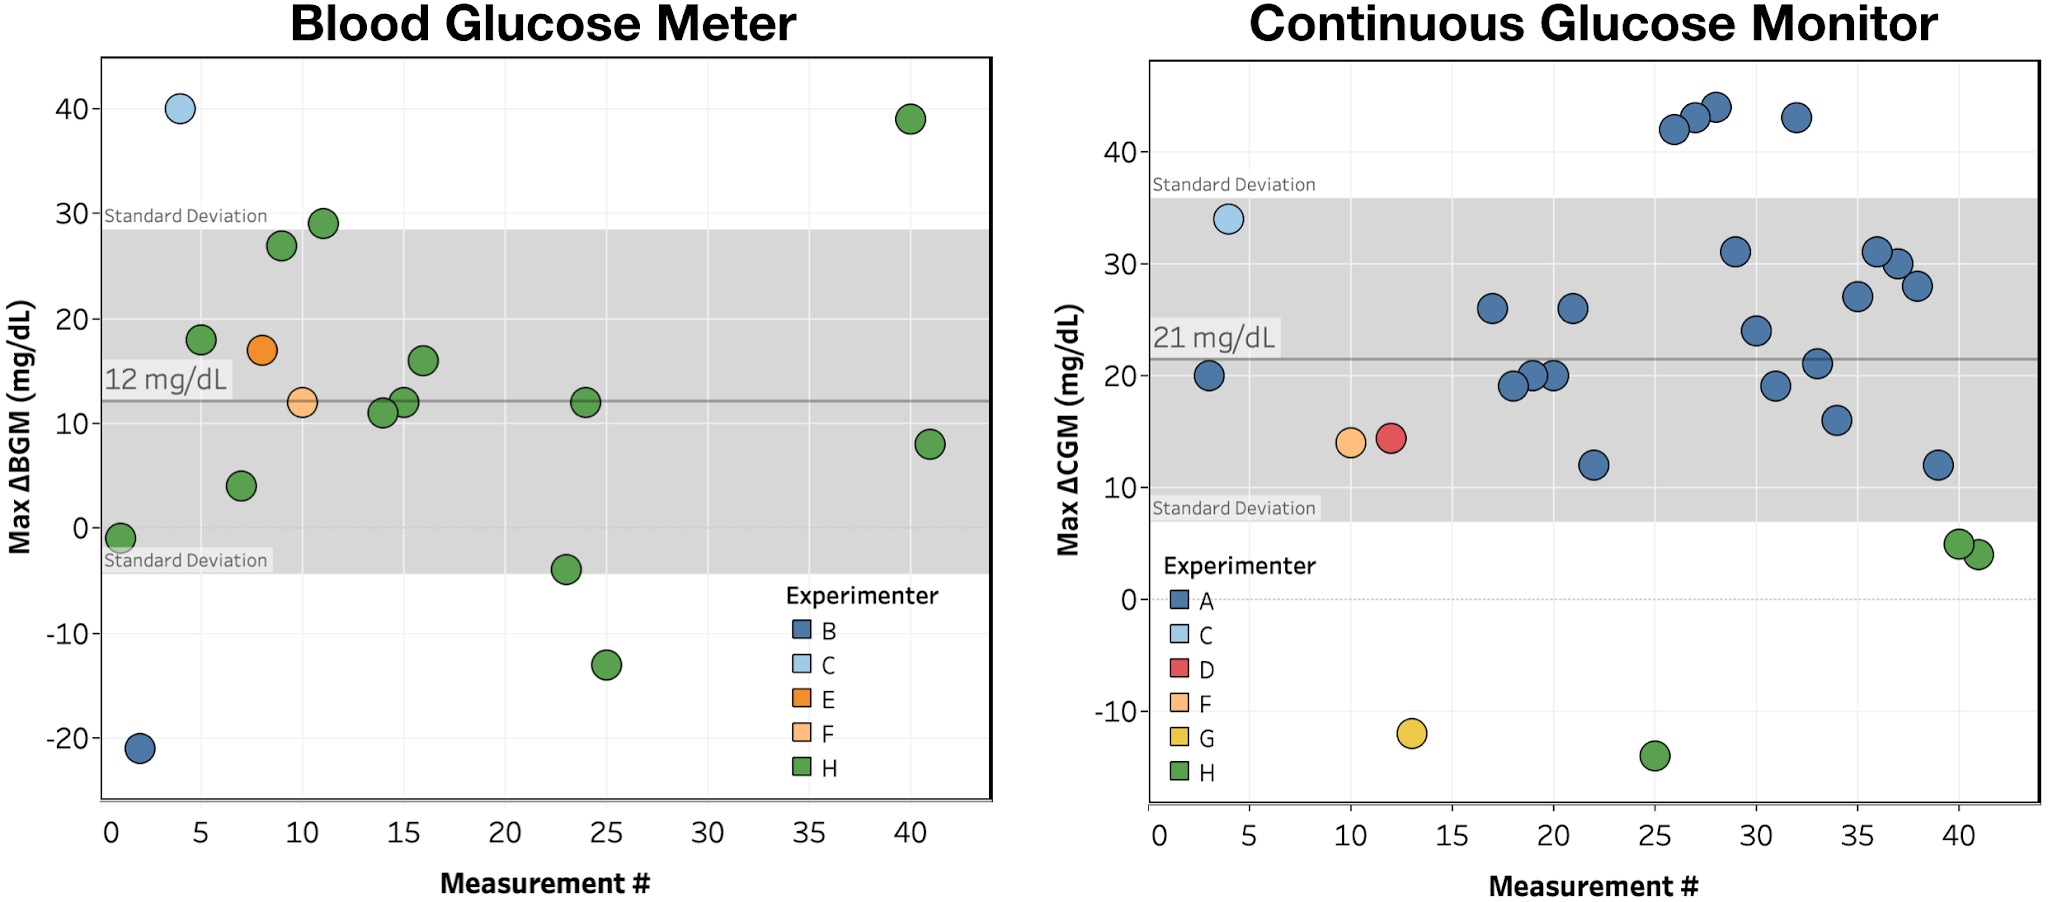
Figure 1. Max ΔBGM & ΔCGM for each shower, colored by experimenter. Reference band shows average +/- 1 standard deviation.
Looking at the data in Figure 1:
There is a large rise in blood glucose following a hot shower, though with significant variance in the size of the effect.
The rise is observed for both BGM (12 ± 17 mg/dL) and CGM (21 ± 15 mg/dL) measurements.
By count, we see (1 measurement excluded due to recording error):
>5 mg/dL increase: 34/40 (85%)
>5 mg/dL decrease: 3/40 (7.5%)
<5 mg/dL change: 3/40 (7.5%)
Conclusion: Blood glucose showed a consistent, measurable increase within 1h of taking a hot shower.
Is the observed change in blood glucose real or a CGM sensor artifact?
Looking again at Figure 1, the increase in blood glucose is seen for both BGM and CGM measurements, indicating that it can’t be just a CGM artifact.
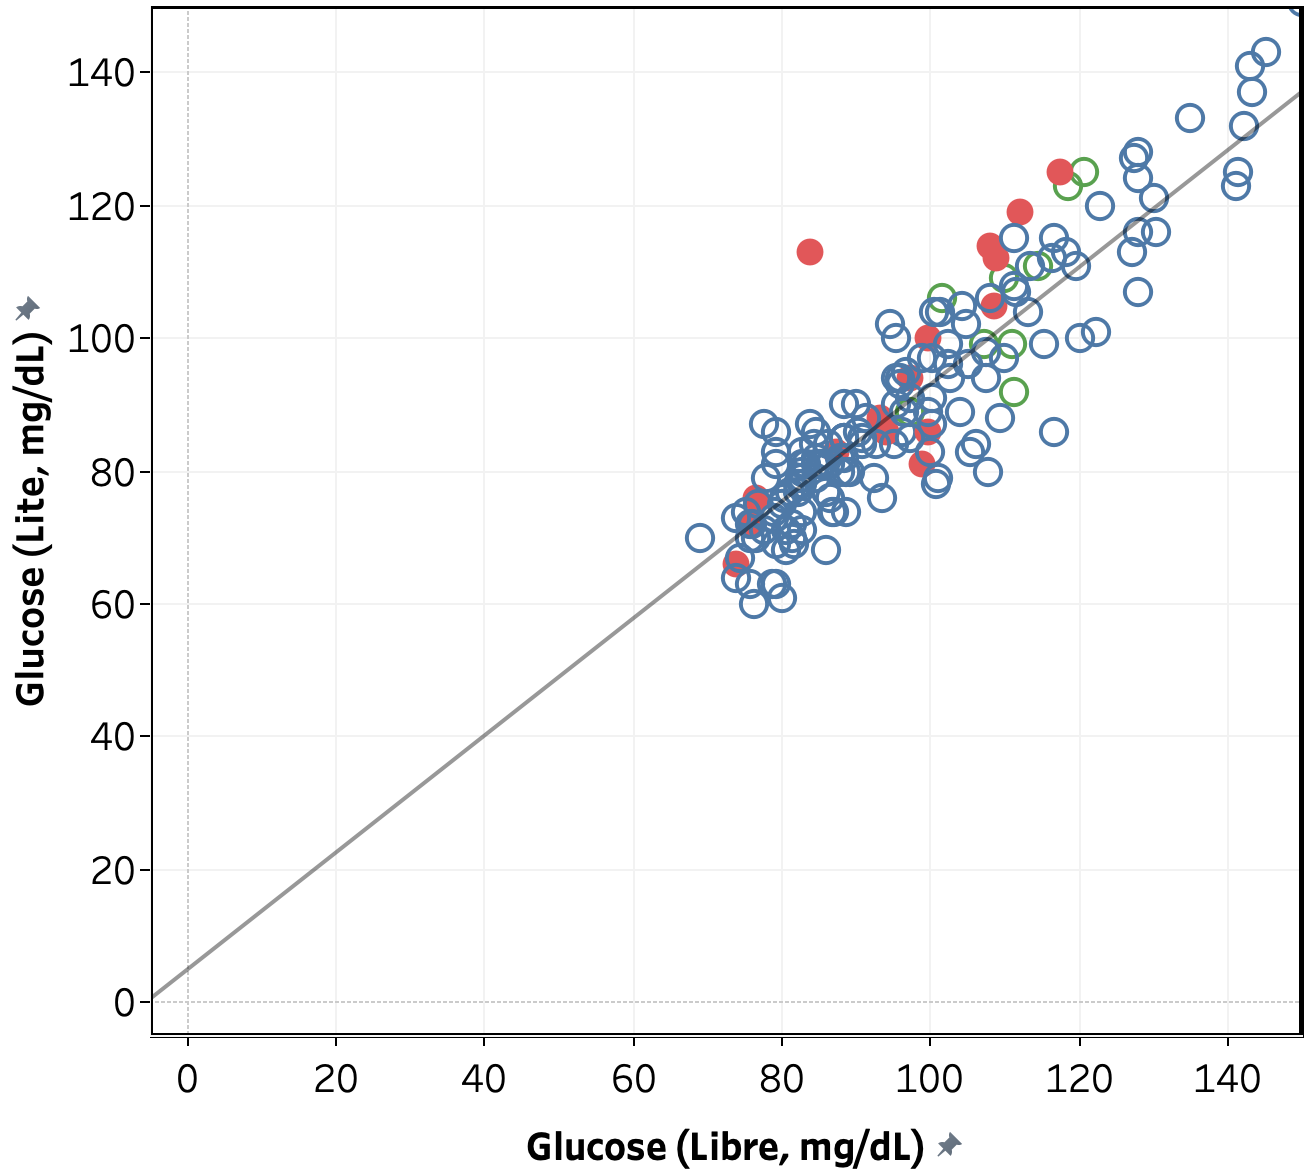
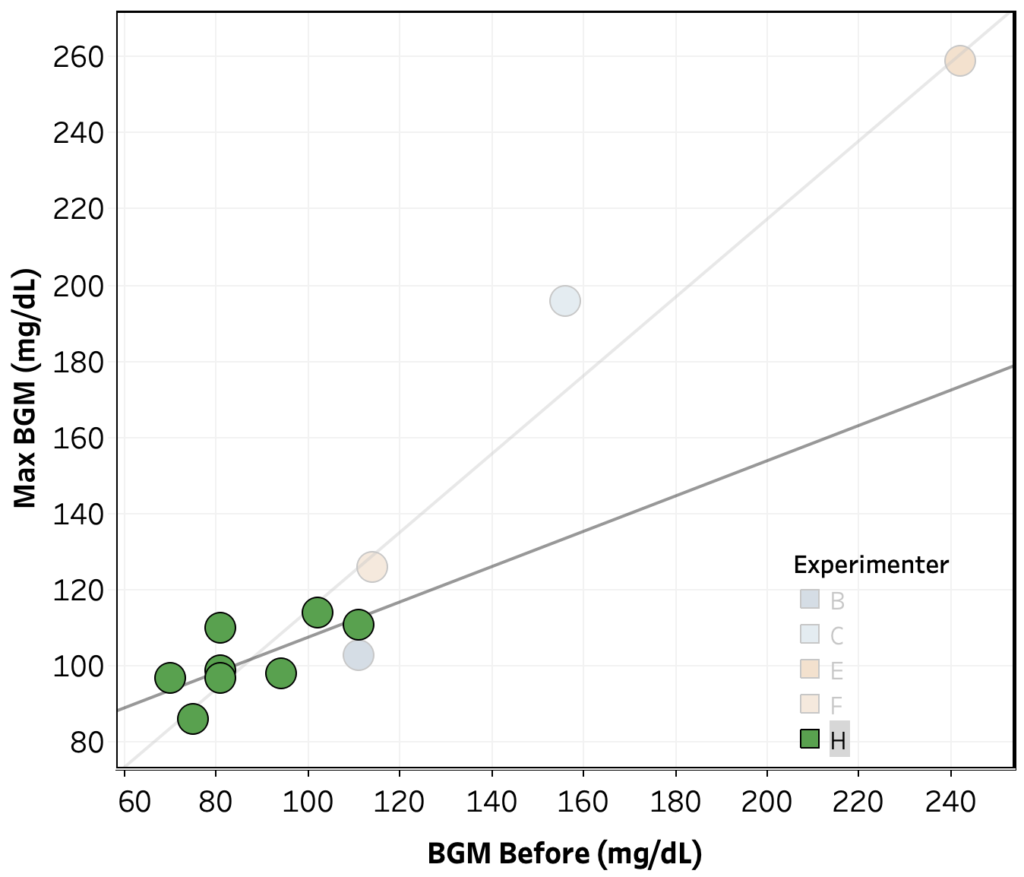
To further confirm this conclusion, we looked at the data from person H comparing BGM vs. CGM measurements during the normal course of the day vs. after a shower. As shown in Figure 2, for a single Libre sensor, there is a linear relationship between measured blood glucose by BGM vs. CGM and the data collected immediately and 15 minutes after a shower mostly lies within the normal variance in the data, with all exceptions showing a lower blood glucose measured by CGM. This indicates that any variation in CGM data due to a sensor artifact is smaller than the observed increase in blood glucose. Note that while this confirms that the measured effect is not exclusively due to a sensor artifact, it is still possible that a sensor artifact accounts for the difference in effect size as measured by BGM vs. CGM (12 vs. 21 mg/dL).
Figure 2. Blood glucose measured by FreeStyle Libre and FreeStyle Freedom Lite for person H over the course of 10 days. Grey line is a linear fit to the data and data collected immediately and 15 min. after a hot shower is shown in red.
Conclusion: The observed increase in blood glucose is not a CGM sensor artifact (though a partial effect from the CGM sensor is not ruled out).
Is there significant person-to-person variation in the magnitude or direction of the effect?
Looking again at the data in Figure 1:
A >5 mg/dL increase in blood sugar is observed for 6/8 (75%) of participants, with 2/8 (25%) showing a >5 mg/dL decrease in blood sugar.
Only 2 participants provided multiple measurements, A and H. For those we observe:
A: 12 ± 16 mg/dL
H: 26 ± 14 mg/dL
The difference is statistically significant (Welch’s t-test, p=0.016), but since the measurements were made using different methods (CGM for A, BGM for H), times (10 min. for A, 20 min. for H), and temperatures, this is only weak evidence for person-to-person variation.
Conclusion: The data is consistent with person-to-person variation, but significantly more data and/or more controlled conditions are required to determine if the variation exists and it’s effect size.
Is the change in blood glucose cause by the hot shower?
This is the most difficult question to answer. In hindsight, we should have done some randomized experiments where the experimenters held conditions as constant as possible, randomly decided whether or not to shower, and measured blood glucose either way. In the absence of that data, we analyzed the data we had for any correlation between the blood glucose rise and non-shower factors. It should be noted that the protocol did not control for any of these factors, so no causation or lack thereof should be inferred from the analysis.
Max ΔBGM or Max ΔCGM vs. hour of the day – no trend across the whole data set, nor within experimenters
Max ΔBGM vs. starting BGM – no trend across the whole data set, but within Experimenter H’s data, there’s an indication of a negative correlation (R2 = 0.32, p = 0.045).
Max ΔCGM vs. starting CGM – no clear trend across the whole data set, nor within experimenters.
Max ΔBGM vs. Temperature – no clear trend across the whole data set, nor within experimenters. Note: most experimenters did not record the shower temperature and the one who did (Person H) kept the temperature within ±3 °C.
Max ΔBGM or Max ΔCGM vs. Time since last meal or medication – There’s a positive correlation over the whole data set, but it doesn’t hold up within the two experimenters with repeat measurements, suggesting that it’s an effect person-to-person variation, possibly caused by systematic variation in conditions.
Conclusion: We can not identify any factors that account for the blood glucose rise other than the shower, but would need significantly more data and/or more controlled conditions to be certain that the shower is the cause.
Conclusions & Lessons Learned
By working together, the team of experimenters was able to learn more and learn faster than any one of us would have been able to on our own. From the data, we were able to answer several of our initial questions.
Conclusions:
What is the change in blood glucose after a hot shower under controlled conditions?
From BGM: 12 ± 17 mg/dL
From CGM: 21 ± 15 mg/dL
Is the observed change in blood glucose real or a CGM sensor artifact?
The change is real, not a sensor artifact (change is observed with BGM; CGM measurements are consistent with typical variation between CGM and BGM)
We cannot rule out the difference in effect size between BGM and CGM being due to a sensor artifact, but the data does not provide support for this hypothesis.
Is there significant person-to-person variation in the magnitude or direction of the effect?
The data is consistent with person-to-person variation, but significantly more data and/or more controlled conditions are required to determine if the variation exists and it’s effect size.
Is the change in blood glucose cause by the hot shower?
We can not identify any factors that account for the blood glucose rise other than the shower, but would need significantly more data and/or more controlled conditions to be certain that the shower is the cause.
While we were not able to get firm answers to all of our questions, we did get a measure of the effect size and rule out it being a CGM sensor artifact (the leading hypothesis in the original post). We also learned a lot that will help guide future Community Self-Experiments.
Key Lessons Learned:
Community Self-Experiments enable collection of data much faster than single-person experiments, both because more people are collecting data and because the group activity motivates participants.
Take more care with the experimental design, especially the implementation of control experiments to help rule out alternate hypotheses.
Implement better data sharing/management. In this experiment, data was posted, then manually entered into an excel sheet, which was very time consuming.
Also posted to Reddit in r/diabetes and r/QuantifiedSelf. Check those out if you want to see/participate in the discussion.
A couple weeks ago, u/NeutyBooty posted on how hot showers caused their blood glucose to rise. Lot’s of commenters confirmed the general observation, but for some it appeared to be a CGM artifact, for some it matched their finger-stick meter, and others they see a BG drop.
To figure out what’s really going on, we decided to do a communal self-experiment. Over the past two weeks, 8 Redditor with diabetes have been measuring their blood glucose before and after showering. So far, we have 22 measurements, so I thought it would be useful to post an initial exploratory analysis of the data to see if the wider community had an insights or suggestions.
In the comments, please chime in with any thoughts, additional analyses, or questions. If there’s any graph, calculation, etc. you’d like to see, let me know and I’ll add it. We also need more experimenters, so if your interested, let me know.
Highlights:
Initial indications are that we are seeing a real and consistent increase in BG from hot showers, not a sensor artifact.
So far, we are not seeing a clear person-to-person variation in the effect (more data needed).
There’s some very tentative but interesting trends in the data:
The effect is stronger with lower initial BG
The effect varies with time of day (could easily be a confounding variable here)
In order to get a clear answer on person-to-person variation and to better pull out any correlations, we need more data, especially repeat data from more people. If you’re interested in joining the experiment, let me know.
Details:
Design/Methods
Protocol here. All data was converted into consistent units and put into an excel spreadsheet. From the raw data, I calculated change in BG from start of shower, as well as the largest relative change, and the time until largest relative change (see spreadsheet for calculation details). Visualization was done using Tableau.
First, let’s look at the big question: are we seeing an effect? For this question, I plotted largest observed change over the 1 hour monitoring period for each shower as measured by both BGM and CGM.
Max ΔBGM & ΔCGM for each shower, colored by experimenter.
Looking at the graphs you can see the following:
We are seeing a measurable rise in blood sugar from a hot shower.
The effect is approximately the same size when measured by BGM vs. CGM, suggesting it’s not a sensor artifact
BIG CAVEAT: We don’t have much data from people with both BGM and CGM, and the majority of data is coming from two experimenters, so this conclusion is very tentative.
We’re not (yet) seeing a clear person-to-person variation. For both BGM and CGM, with the exception of 1 outlier in each case, there’s a pretty consistent increase in BG after a shower.
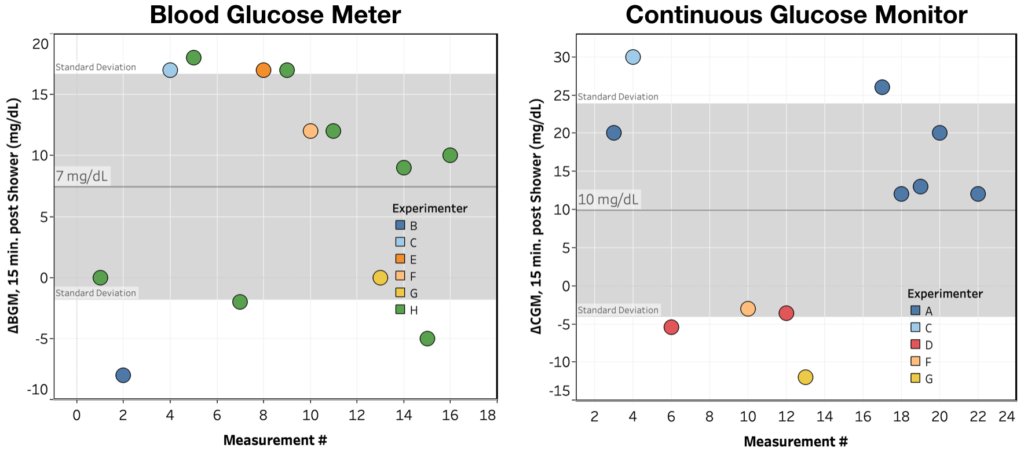
Interestingly, while we consistently see an increase in BG after showering, the timing of that increase is much more variable. If instead of looking at Max ΔBG over the monitoring period, you look at ΔBG 15 minutes after the shower, you get:
ΔBGM & ΔCGM@15 min. for each shower, colored by experimenter.
While we still see the effect, it’s a a lot more variable, especially in the BGM measurements.
Next, even though there’s not enough data for solid conclusions, I thought it’d be interesting to see if there was any interesting patterns/correlations in the data. I looked at:
ΔCGM@15 min. vs. ΔBGM@15 min. – only three data points, so can’t really say anything
Max ΔCGM vs. Max ΔBGM – two data points, can’t say anything
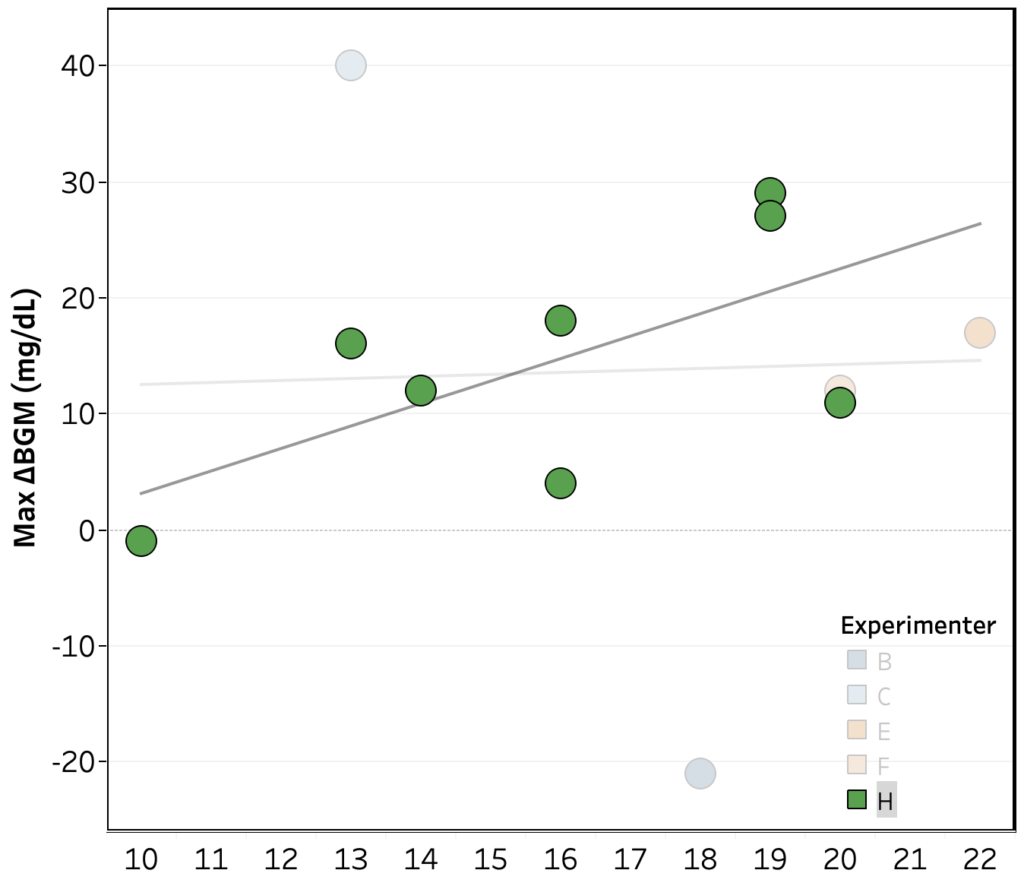
Max ΔBGM vs. hour of the day – no trend across the whole data set, but within Experimenter H’s, there’s an indication of a greater rise later in the day (R2 = 0.40, p = 0.08)
Max ΔCGM vs. hour of the day – no clear trend across the whole data set, nor within experimenters
Max ΔBGM vs. starting BGM – no trend across the whole data set, but within Experimenter H’s data, there’s an indication of a strong negative correlation (R2 = 0.57, p = 0.03).
Max ΔCGM vs. starting CGM – no clear trend across the whole data set, nor within experimenters.
Max ΔBGM vs. hour of the day, colored by experimenter. Data from Experimenter H highlighted, showing a clearing increasing trend (R2 = 0.4, p = 0.08)Max ΔBGM vs. initial BGM, colored by experimenter. Data from Experimenter H highlighted, showing a clearing decreasing trend (R2 = 0.57, p = 0.03)
A few days ago, u/NeutyBooty posted on how hot showers caused their blood glucose to rise. Lot’s of commenters confirmed the general observation, but for some it appeared to be a CGM artifact, for some it matched their finger-stick meter, and others they see a BG drop.
We currently have 7 Redditors participating from the original thread, but I’m hoping we can get even more people signed up so we can get a really great data set. Anyone’s who’s interested in participating, please comment or PM me.
The basic idea is to agree on a simple experimental protocol, each of us run the experiment, combine and analyze the data, and see if we can figure out 1) Is the shower effect real or a CGM artifact and 2) how does it vary from person-to-person?
The 7 of us organized and worked out the protocol using group chat and and a new subreddit, r/QuantifiedDiabetes. We’re starting the experiments and looking for more participants.
Here’s the details:
Background:
In u/NeutyBooty‘s post on hot showers causing blood glucose to rise, lot’s of commenters confirmed the general observation, but for some it appeared to be a CGM artifact, for some it matches BGM, and for others they see a BG drop.
From my PMs, some of us have CGM’s, some have regular BGM’s, and some have both.
Questions to answer:
Is the “hot shower effect” a real change in blood glucose or an artifact of CGM sensors getting warm (or some other environmental change)?
What is the person-to-person variation in the magnitude and direction of the “hot shower effect?”
Protocol:
Pick a time when your blood glucose is relatively stable (no recent meals, medication, exercise, etc.)
Turn on the shower to the hottest temperature you’re comfortable with and let the temperature stabilize. If possible, measure the temperature (e.g. with an instant read thermometer).
Measure your blood glucose with both a CGM and regular finger-stick meter and record the data.
If you don’t have both types of meters, use whichever you do have (data will still be useful for the second goal)
Take a 20 minute shower.
As soon as you finish the shower, measure your blood glucose again with both a CGM and regular finger-stick meter and record the data.
Monitor your blood sugar for one hour (measure every 15 min. for finger-stick meter)
Record anything that might have affected blood glucose during the experiment.
Repeat the experiment multiple times (preferably ≥3, but any data is better than nothing) to assess within-person variability.
Post your data in a comment or PM to u/sskaye. I’ll compile it and make available to everyone to analyze
If you want your data to be anonymous, just let me know and I’ll remove all identifying info.
Optional variations:
Vary the time or temperature of the shower
Try a bath, hot tub, or sauna instead of a shower.
Data to collect:
For each glucose measurement: time, blood glucose, any important observations