No correlation (R2=0.03) between average glucose and sleep score (Oura ring, R2=0.003)
Slight correlation (R2=0.09) between last glucose value before sleep and deep sleep (Oura ring)
Strong correlations (R2=0.36, 0.92, & 0.98) between total sleep the previous night and “meal scores” (a measure of the blood glucose impact calculated by the Veri app from the CGM data).
From my own data, I also haven’t seen a correlation between average glucose and time asleep, but I never thought to check impact on just meals to reduce noise in the measurement.
For the correlations with specific meals, Ilmo had a relatively small data set (3 meals, 4 datapoints each), but the effect was consistent and strong.
I’m interested to see whether I can detect the same effect. I eat a very consistent breakfast and relatively consistent lunch, so I should be able to get a statistically robust measurement in a relatively short time.
I’m pre-registering the experiment here for data quality & transparency and to get feedback on the experimental design.
Details
Experiment
Breakfast:
I will take 4.5u of Novolog (fast acting insulin, duration of 2-4h), wait 30 min., then eat 50g ketochow with 2 tbsp. of butter (website, BG testing).
This is my standard breakfast and insulin dosage and will be used every day.
Lunch:
I will take 3u of Novolog (fast acting insulin, duration of 2-4h), wait 15 min., then eat 50g ketochow with 2 tbsp. of butter (website, BG testing).
This is my standard lunch and insulin dosage when I’m not doing a food effect experiment. On days when I am doing a food effect experiment or otherwise need to deviate from this meal, I won’t record data.
Measurements
Blood glucose will be monitored using a Dexcom G6.
Sleep will be measured using the Oura Ring 3
For each meal, I will record:
Time of insulin injection
Amount of insulin injected
Time of meal
Any additional observations
Analysis
I will conduct an analysis after collecting 30 days of data. If the results are inconclusive, I will collect an additional 30 days of data and re-analyze.
Peak change in blood glucose and area under the curve will be calculated for the 2h after each meal.
Pearson R (with 95% CI) and p-value will be calculated for the following correlations:
Peak change in blood glucose vs. time asleep (breakfast & lunch)
iAuC vs. time asleep (breakfast & lunch)
Average daily glucose vs. time asleep (prev. night)
Average daily glucose vs. sleep score (prev. night)
Please let me know if you have any comments or suggestions on the experimental design.
I will start recording data immediately and will report out the results on March 12th
There are a number of other meters I’m interested in trying out, so I decided to expand the study. I’m pre-registering the experiment here for data quality & transparency and to get feedback on the choice of meter and experimental design.
Does anyone have recommendations for interesting blood glucose meters they’d like to see me test?
Details
Meter Selection
To find blood glucose meters to test, I searched Google, Amazon, various diabetes forums, and posted to r/diabetes. I also looked at academic papers testing the accuracy of different meters, the most useful of which was a paper from Russell and co-workers. Based on this, I selected the following meters to test:
Control: FreeStyle Freedom Lite
This is the meter I’ve been using since I got diabetes ~10 years ago. It ranks 5th on accuracy in the paper from Russell and co-workers and requires very little blood, making it easy and quick to use.
Precision: Contour Next & OneTouch Verio Flex
These were the two most accurate and precise meters from the paper from Russell and co-workers.
The actual OneTouch meter from the paper was the VerioIQ, but that’s no longer available. The Verio Flex is a newer meter from OneTouch, so hopefully it’s as good or better.
Low-cost: ReliOn Premier
This is Wallmart’s low-cost meter. It didn’t perform well in the paper from Russell and co-workers, but it’s only $18 for 100 strips without insurance, so I’m interested to see how it compares.
All three of these have the meter, lancets, and strips contained in a single device, making carrying the meter much more convenient.
Pogo had the same promise, but was less accurate and more painful, so I’m really interested to see if these work better.
Meters that are of interest, but I can’t get: Beurer 50 GL Evo & Glucorx
These both look interesting, but are not available where I live. If anyone has a suggestion on how I can get them, I’ll add them to the experiment.
Experiment
I will test my blood glucose once per day for 15 days, rotating between three times: pre-lunch, pre-dinner, and before bed.
At each time, I will take 3 measurements with each meter and record the results from my Dexcom G6, along with any failed test strips and observations on convenience, pain, and other user experience.
This will result in 15 sets of 3 measurements for each meter, for a total of 45 measurements/meter or 315 total blood glucose measurements (more if I get additional meters).
Analysis
For each meter I will calculate the pooled standard deviation, bias (vs. Freestyle Freedom Lite), and mean absolute difference (vs. FreeStyle Freedom Lite).
All values will be reported with 95% confidence intervals & data will be visualized using Tableau.
Please let me know if you have any comments or suggestions on the choice of meters or experimental design.
The last meter should be arriving by February 13th, so I will report out the results on March 5th.
This post is an update on my experiment testing whether inspiratory muscle training reduces my blood pressure. Below is an interim analysis of the first 3 weeks of the 6 week, pre-registered experiment. So far, I’m seeing a large improvement in inspiratory muscle strength, but no effect on blood pressure. Not looking good, but hopefully I’ll start seeing an effect on blood pressure in the next few weeks.
Summary
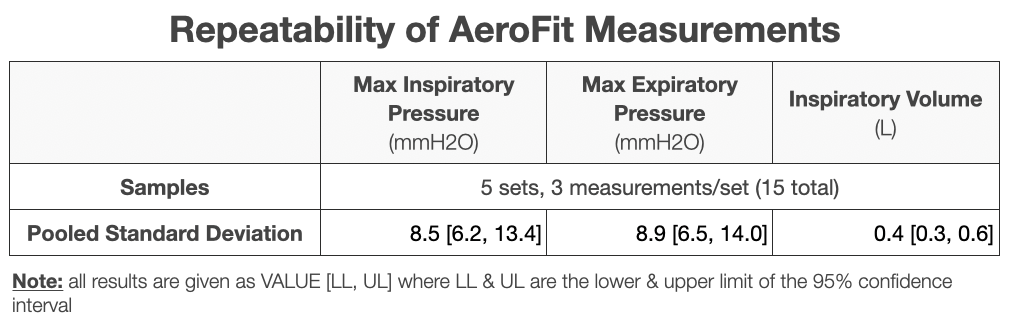
Measurement Precision:
The Aerofit shows sufficient precision for measuring inspiratory volume and maximum inspiratory & expiratory pressure (see Table below), with a standard deviation < the week-to-week improvement.
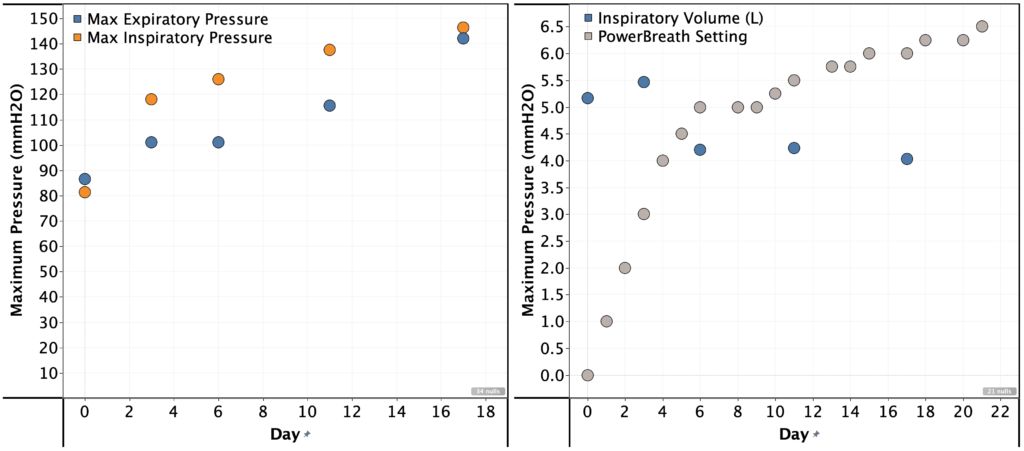
Strength Improvement:
I was able to significantly increase the resistance setting on the PowerBreath. In week 1, I couldn’t complete the full set of breaths at setting 5. By week 3, I could do so for setting 6.25.
This correlated with a large increase maximum inspiratory & expiratory pressure, but a reduction in inspiratory volume.
Maximum inspiratory pressure: 81 -> 146 mmH2O
Maximum expiratory pressure: 87 -> 142 mmH2O
Maximum inspiratory volume: 5.2 -> 4.0 L
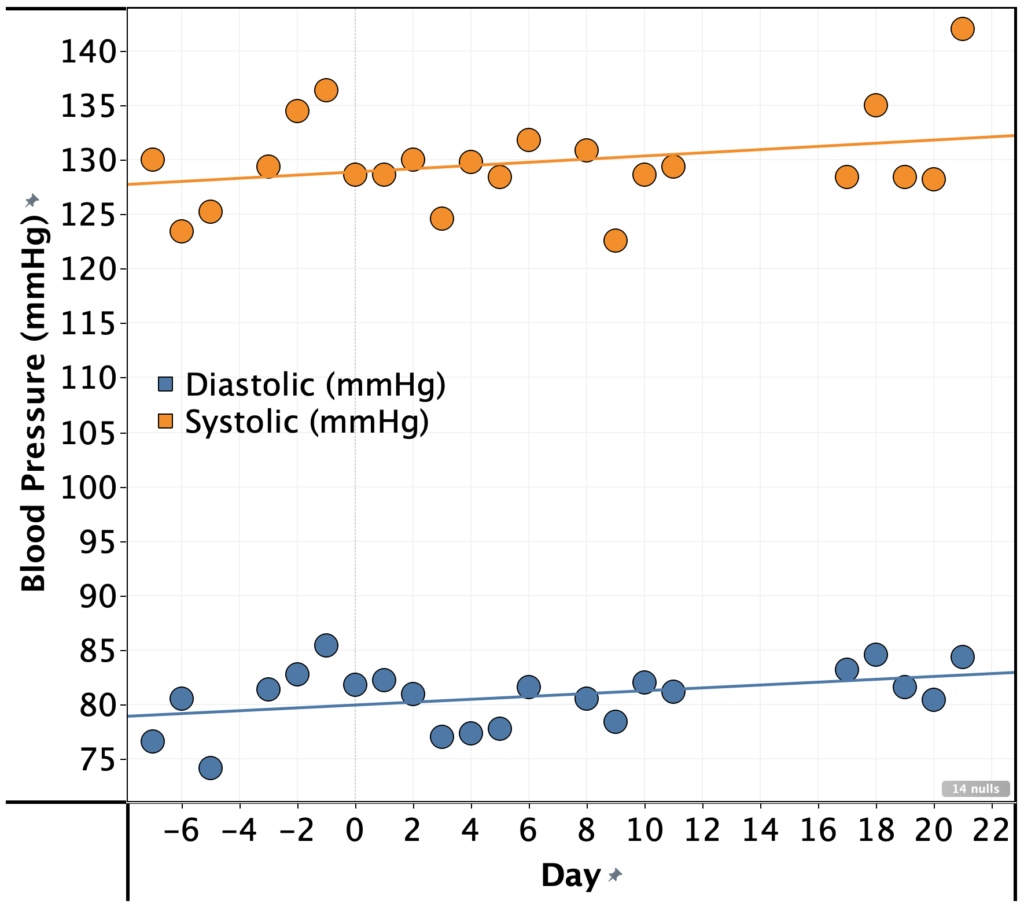
Blood Pressure:
Despite the large improvement in inspiratory muscle strength, I’ve seen a no improvement in my blood pressure in the first 3 weeks. In fact, it’s gotten slightly worse (see graph).
Systolic: 130 -> 132 mmHg
Diastolic: 80 -> 84 mmHg
Conclusions & Next Steps:
The experiment was pre-registered for 6 weeks, so I will complete the remaining 3 weeks and a full analysis of the results.
I increased the PowerBreath setting by 1 unit per day until I was unable to maintain full pressure for all 5 sets. After that, I followed the pre-registered protocol of increasing by 0.25 when I was able to complete all 5 sets without struggle.
Reason: the lowest settings were way too easy and I wanted to get to a setting that would be a challenge more quickly.
AeroFit measurements frequency varies from the planned frequency of every 3 days.
Reason: I sometimes forgot.
Blinding
This experiment was not blinded
Procedure
Once per day, I did 5 sets of 6 breaths, with 1 min. rest in-between sets using the PowerBreathe HR.
If I struggled to complete all sets, I left the load setting as-is. If not, I increased by 0.25 turns of the load setting knob.
Every 3-5 days, I measured my maximum inspiratory pressure, expiratory pressure, and inspiratory volume using an Aerofit Pro.
Each morning at ~6am, I measured my blood pressure and pulse using an Omron Evolve
Measurements
Blood Pressure
Instrument: Omron Evolve blood pressure meter
Method:
For each measurement, I placed the meter on my left arm, ~4 cm above my elbow.
Measurements were taken seated, with my feet on the ground and arms resting on a flat surface at a comfortable height (same every time).
5 measurements were taken with no pause in-between measurements (other than to write down the result) and the average of the 5 measurements was used.
Breathing:
Instrument: AeroFit Pro
Method:
Following the instruction in the AeroFit app
3 measurements were taken with no pause in-between measurements (other than to write down the result) and the average of the 3 measurements was used.
On a previous post in my blood pressure series, u/OrganicTransistor suggested trying to strengthen my respiratory muscles based on the results in this paper by Seals and co-workers.
The paper, the authors report a pre-registered, sham-controlled, double-blind RCT of whether inspiratory muscle strength training lowers blood pressure. Here’s a quick summary:
36 participants, all with blood pressure >120 mmHg systolic and no indication of uncontrolled diabetes, cholesterol, or thyroid disease or severe obesity.
Participants underwent 6 weeks of IMST using a PowerBreathe K3
Each week, the experimenters measured the participants max inspiratory pressure
The experimental group trained daily at 75% of max inspiratory pressure (5 sets of 6 breaths with 1 min. rest in-between)
The control group trained at very low resistance.
Results:
Systolic: experimental group saw a decrease of 9 mmHg systolic vs. 3 mmHg systolic for the sham-training group (P < 0.01 for difference of means).
Diastolic: experimental group saw a decrease of 2 mmHg systolic vs. 0 mmHg systolic for the sham-training group (P = 0.03 for difference of means).
Results were similar in magnitude and statistically significant when stratified by sex.
Effect persisted 6 weeks after training was stopped.
This is a huge effect size for blood pressure reduction. Given that it was pre-registered, blinded, and sham-controlled, I think it’s worth trying to see if it works for me.
Towards that end, I’m pre-registering the following self experiment:
Approach
I will replicate the published procedure as much as possible, with the following changes:
Instead of a PowerBreathe K3, I will use a PowerBreathe HR for training and an AeroFit Pro for measuring my progress
Reason: The K3 is ~$500, out of my price range for an initial replication
Instead of setting the resistance to a percentage of my max inspiratory pressure, I will increase the load until it is difficult to maintain steady, high pressure for the full 5 sets. Then I will increase by 0.25 turns of the load setting knob whenever I feel able to do so.
Reason: The HR does not have the ability to set a specific load force. The procedure I’m using is the one recommended for training in the PowerBreath HR manual
Procedure
Once per day, I will do 5 sets of 6 breaths, with 1 min. rest in-between sets using the PowerBreathe HR.
If I struggle to complete all sets, I will leave the load setting as-is. If not, I will increase by 0.25 turns of the load setting knob.
Every 3 days, I will measure my maximum inspiratory pressure, expiratory pressure, and inspiratory volume using an Aerofit Pro
Each morning at ~6am, I will measure my blood pressure and pulse using an Omron Evolve
Measurements
Blood pressure:
Instrument: Omron Evolve blood pressure meter
Method:
For each measurement, I will place the meter on my left arm, ~4 cm above my elbow. Measurements will be taken seated, with my feet on the ground and arms resting on a flat surface at a comfortable height (same every time).
5 measurements will be taken with no pause in-between measurements (other than to write down the result) and the average of the 5 measurements will be used.
Breathing:
Instrument: AeroFit Pro
Method:
I will follow the instructions provided by the AeroFit app
3 measurements will be taken with no pause in-between measurements (other than to write down the result) and the average of the 3 measurements will be used.
Analysis
Primary endpoints will be systolic and diastolic pressure for the week prior to and immediately after 6 weeks of training.
Secondary endpoints will be:
maximum inspiratory pressure, expiratory pressure, and inspiratory volume, and pulse for the week prior to and immediately after 6 weeks of training.
All primary and secondary endpoints every two weeks during training
If any significant effects are observed, I will continue tracking for an additional 6 weeks to see if the effect persists.
Effects will be considered of significant magnitude if a reduction of at least 3 mmHg is observed with a p-value of < 0.05.
These experiments started ~1 week ago, though I haven’t looked at the data. I expect to have the first interim analysis in 2 weeks and the full study results in 7 weeks.
This is an update on my experiments to determine the cause and methods to reduce my elevated blood pressure. In this post, I take a look at the correlations between blood pressure and my other self-tracking metrics.
I didn’t find any large or actionable effects, but I’m concerned that the statistical analysis I did was too simplistic or otherwise not correct.
If anyone is interested in taking a look at the data, let me know. All the raw data is provided below, but I’m happy to do additional data processing/cleaning if it would be helpful.
Summary
Background:
I’ve been measuring blood pressure, sleep, weight, hemoglobin, and cholesterol for the past 6 months.
This provides a (hopefully) rich dataset for identifying environmental or lifestyle factors that influence my blood pressure.
Notably, I observed that my blood pressure seems elevated on days after after I’ve had low blood sugar the night before, indicating a possible effect (no statistical or other rigorous analysis done)
Approach:
6 months of self tracking data was aggregated and cleaned.
Pearson R and p-value were calculated for 26 metrics that seemed most likely to influence blood pressure compared with systolic pressure, diastolic pressure, and pulse.
Results & Conclusions:
No metric had a large & statistically significant correlation with either systolic or diastolic
Sleep had the largest correlation with systolic pressure:
Effect Size: -1.1 mmHg/h asleep
R2 = 0.05
p-value = 0.03
There was a statistically significant correlation between cholesterol and both systolic & diastolic pressure, but it was in an implausible direction (higher cholesterol showed lower blood pressure), so is likely due to a common cause.
Pulse showed a strong correlation with fasting blood glucose. My suspicion is that this is related to the dawn phenomenon (liver dumping glucose into the blood in the morning to provide energy) as the time from waking up to doing my BP measurements may be correlated to both measures.
Effect Size: 0.08 bpm/(mg/dL glucose)
R2 = 0.14
p-value = 0.0005
Pulse also showed a strong correlation with body weight, though this is likely due to increased aerobic exercise during the same time period.
Next Steps:
Given the small effect sizes and lack of statistical significance, unless I screwed up the analysis, I don’t see any reason to follow up on these results.
Instead, I’ll take a look after 3-6 months and see if additional data surfaces anything useful.
Inspiratory muscle training:
u/OrganicTransistor suggested trying strengthening my respiratory muscles based on the results in this paper.
The results look promising, so I’m going to give the protocol in the paper a try.
This study will take six weeks. I’ve currently completed 8 days and will do an interim analysis every two weeks.
Decrease Sodium/Potassium ratio
Sodium/Potassium ratio has been shown to strongly correlate with blood pressure and incidence of heart disease.
Many years ago, my dad has high blood pressure that lowered significantly when he reduced his sodium intake.
I’m going test substituting a large fraction of my added sodium intake with potassium. Experimental details and pre-registration to follow in a separate post.
Details
Purpose
To determine if any of the metrics I track correlate with blood pressure.
I’ve been measuring blood pressure, sleep, weight, hemoglobin, and cholesterol for the past 6 months.
This provides a (hopefully) rich dataset for identifying environmental or lifestyle factors that influence my blood pressure.
Notably, I observed that my blood pressure seems elevated on days after after I’ve had low blood sugar the night before, indicating a possible effect (no statistical or other rigorous analysis done)
Results & Discussion
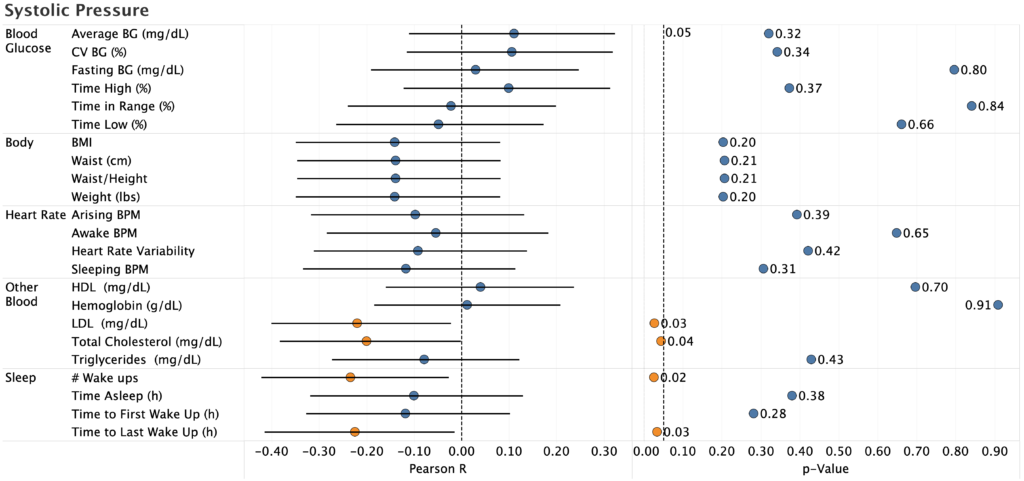
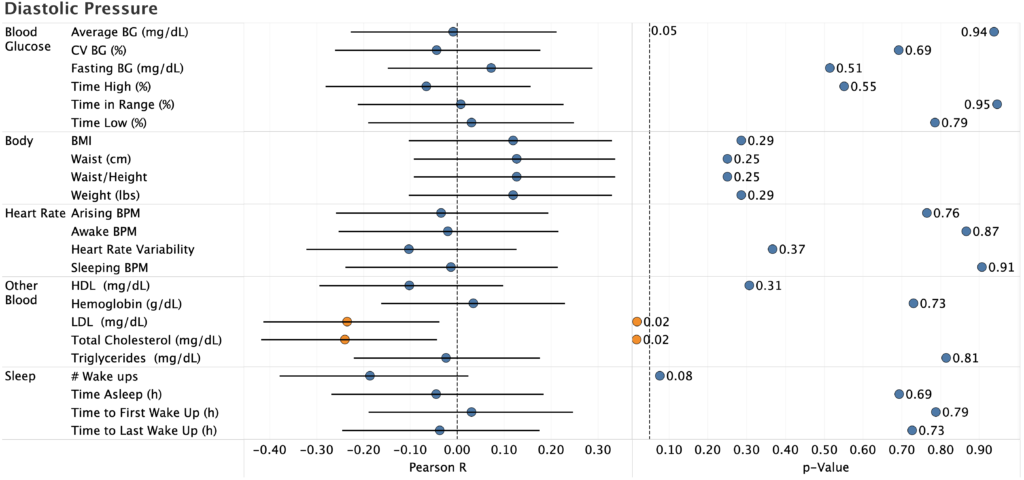
Systolic & Diastolic Pressure
The only statistically significant effects were:
Total cholesterol (systolic and diastolic)
LDL (systolic and diastolic)
# Wake ups (systolic only)
Time to Last Wake Up (manual recording of time asleep, systolic only)
Pearson R is negative for the two cholesterol correlations, which is biologically implausible (there’s no reason high cholesterol would reduce blood pressure). Since I only measure cholesterol once every two weeks, there’s not much data there, so it’s likely a spurious correlation.
For sleep, the correlation is likely real (p=0.03, 95%CI does not overlap zero), but the effect size is to small to be useful:
R2 = 0.05
-1.1 mmHg/h of sleep (i.e. I’d need to sleep an additional 5h to reduce BP by 5 mmHg, which is impossible even if the effect stayed linear)
This gives further evidence to the desirability of keeping my sleep under control, but does not provide a way to meaningfully reduce my blood pressure (I already sleep 6-6.5h/night, so there’s not enough room for improvement).
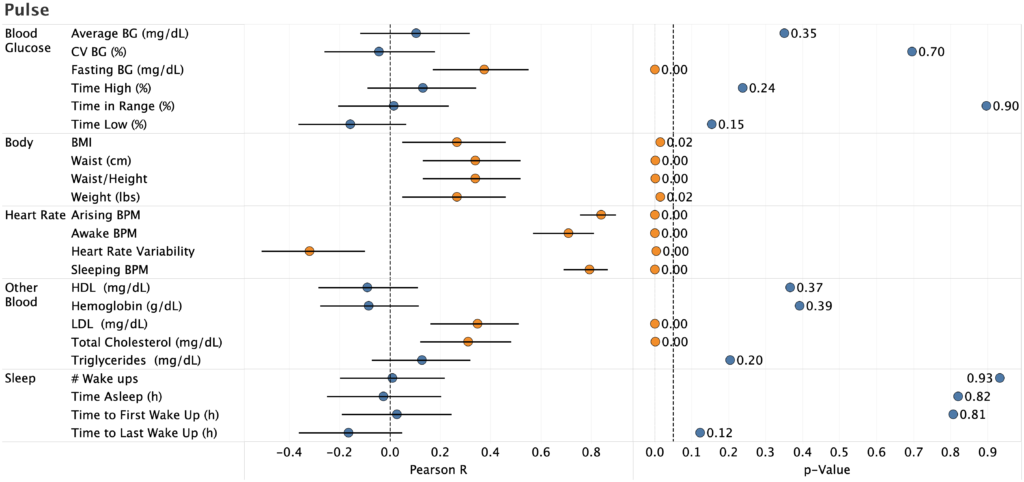
Pulse
Unsurprisingly, pulse strongly correlated with pulse and heart rate variability measured by my Apple Watch. Nice to see, but not actionable.
Strong correlation with fasting blood glucose with a large effect size.
Effect Size: 0.08 bpm/(mg/dL glucose)
R2 = 0.14
p-value = 0.0005
My suspicion is that this is related to the dawn phenomenon (liver dumping glucose into the blood in the morning to provide energy) as the time from waking up to doing my BP measurements may be correlated to both measures. I already work to keep my fasting BG in the normal range for a non-diabetic, so there’s nothing actionable here.
There’s also a strong correlation between pulse and body weight, though this is likely due to increased aerobic exercise during the same time period.
I’m concerned, however, that the statistical analysis I did was too simplistic or otherwise not correct. In particular:
Would a mixed-effect model or other more sophisticated technique surface effects that I can’t detect?
Are there interaction effects that, if accounted for, would provide better predictive value?
Are there other metrics that I missed (e.g. different time lags)?
If anyone is interested in taking a look at the data, let me know. All the raw data is provided below, but I’m happy to do additional data processing/cleaning if it would be helpful.
Absent someone finding an effect I missed, I don’t see any reason to follow up on these results. Instead, I’ll take a look after 3-6 months and see if additional data surfaces anything useful.
In the meantime, I’ll focus on testing additional interventions. Specifically:
Inspiratory muscle training:
u/OrganicTransistor suggested trying strengthening my respiratory muscles based on the results in this paper.
The results look promising, so I’m going to give the protocol in the paper a try.
This study will take six weeks. I’ve currently completed 8 days and will do an interim analysis every two weeks.
Decrease Sodium/Potassium ratio
Sodium/Potassium ratio has been shown to strongly correlate with blood pressure and incidence of heart disease.
Many years ago, my dad has high blood pressure that lowered significantly when he reduced his sodium intake.
I’m going test substituting a large fraction of my added sodium intake with potassium. Experimental details and pre-registration to follow in a separate post.
Instead of a mixed-effect model, I just calculated Pearson R and p-value for each correlation.
Reason: Since there were no effects of a practical/ actionable magnitude, I didn’t spend the effort to figure out how to implement the mixed effect model.