No correlation (R2=0.03) between average glucose and sleep score (Oura ring, R2=0.003)
Slight correlation (R2=0.09) between last glucose value before sleep and deep sleep (Oura ring)
Strong correlations (R2=0.36, 0.92, & 0.98) between total sleep the previous night and “meal scores” (a measure of the blood glucose impact calculated by the Veri app from the CGM data).
From my own data, I also haven’t seen a correlation between average glucose and time asleep, but I never thought to check impact on just meals to reduce noise in the measurement.
For the correlations with specific meals, Ilmo had a relatively small data set (3 meals, 4 datapoints each), but the effect was consistent and strong.
I’m interested to see whether I can detect the same effect. I eat a very consistent breakfast and relatively consistent lunch, so I should be able to get a statistically robust measurement in a relatively short time.
I’m pre-registering the experiment here for data quality & transparency and to get feedback on the experimental design.
Details
Experiment
Breakfast:
I will take 4.5u of Novolog (fast acting insulin, duration of 2-4h), wait 30 min., then eat 50g ketochow with 2 tbsp. of butter (website, BG testing).
This is my standard breakfast and insulin dosage and will be used every day.
Lunch:
I will take 3u of Novolog (fast acting insulin, duration of 2-4h), wait 15 min., then eat 50g ketochow with 2 tbsp. of butter (website, BG testing).
This is my standard lunch and insulin dosage when I’m not doing a food effect experiment. On days when I am doing a food effect experiment or otherwise need to deviate from this meal, I won’t record data.
Measurements
Blood glucose will be monitored using a Dexcom G6.
Sleep will be measured using the Oura Ring 3
For each meal, I will record:
Time of insulin injection
Amount of insulin injected
Time of meal
Any additional observations
Analysis
I will conduct an analysis after collecting 30 days of data. If the results are inconclusive, I will collect an additional 30 days of data and re-analyze.
Peak change in blood glucose and area under the curve will be calculated for the 2h after each meal.
Pearson R (with 95% CI) and p-value will be calculated for the following correlations:
Peak change in blood glucose vs. time asleep (breakfast & lunch)
iAuC vs. time asleep (breakfast & lunch)
Average daily glucose vs. time asleep (prev. night)
Average daily glucose vs. sleep score (prev. night)
Please let me know if you have any comments or suggestions on the experimental design.
I will start recording data immediately and will report out the results on March 12th
There are a number of other meters I’m interested in trying out, so I decided to expand the study. I’m pre-registering the experiment here for data quality & transparency and to get feedback on the choice of meter and experimental design.
Does anyone have recommendations for interesting blood glucose meters they’d like to see me test?
Details
Meter Selection
To find blood glucose meters to test, I searched Google, Amazon, various diabetes forums, and posted to r/diabetes. I also looked at academic papers testing the accuracy of different meters, the most useful of which was a paper from Russell and co-workers. Based on this, I selected the following meters to test:
Control: FreeStyle Freedom Lite
This is the meter I’ve been using since I got diabetes ~10 years ago. It ranks 5th on accuracy in the paper from Russell and co-workers and requires very little blood, making it easy and quick to use.
Precision: Contour Next & OneTouch Verio Flex
These were the two most accurate and precise meters from the paper from Russell and co-workers.
The actual OneTouch meter from the paper was the VerioIQ, but that’s no longer available. The Verio Flex is a newer meter from OneTouch, so hopefully it’s as good or better.
Low-cost: ReliOn Premier
This is Wallmart’s low-cost meter. It didn’t perform well in the paper from Russell and co-workers, but it’s only $18 for 100 strips without insurance, so I’m interested to see how it compares.
All three of these have the meter, lancets, and strips contained in a single device, making carrying the meter much more convenient.
Pogo had the same promise, but was less accurate and more painful, so I’m really interested to see if these work better.
Meters that are of interest, but I can’t get: Beurer 50 GL Evo & Glucorx
These both look interesting, but are not available where I live. If anyone has a suggestion on how I can get them, I’ll add them to the experiment.
Experiment
I will test my blood glucose once per day for 15 days, rotating between three times: pre-lunch, pre-dinner, and before bed.
At each time, I will take 3 measurements with each meter and record the results from my Dexcom G6, along with any failed test strips and observations on convenience, pain, and other user experience.
This will result in 15 sets of 3 measurements for each meter, for a total of 45 measurements/meter or 315 total blood glucose measurements (more if I get additional meters).
Analysis
For each meter I will calculate the pooled standard deviation, bias (vs. Freestyle Freedom Lite), and mean absolute difference (vs. FreeStyle Freedom Lite).
All values will be reported with 95% confidence intervals & data will be visualized using Tableau.
Please let me know if you have any comments or suggestions on the choice of meters or experimental design.
The last meter should be arriving by February 13th, so I will report out the results on March 5th.
In a previous post, I mentioned that I get a runny nose when I go for a walk in the mornings or a run in the evening. It’s not terrible, but is annoying and prevents me from breathing comfortably through my nose. I hypothesized that this was caused by allergies and proposed some experiments to check whether this was the case.
I got great feedback on that post, both from Reddit and the Quantified Self forum. In particular, several commenters suggested:
Making sure the experiments could distinguish between cold & allergens as the cause
Testing indoor exercise & no exercise in the same outdoor locations
Using an N95 mask as an alternative to allergy medicine as means of assessing whether allergens are the cause
Keeping track of weather and pollen counts during the experiment as potential confounders
Following up on these suggestions, I did a few quick experiments to narrow down what might be going on:
I sat outside, not exercising, in the same location I take my morning walk. After 1h, I did not get a runny nose. I then started walking and developed a runny nose within 15 min. (the same intensity as has occurred every day since I’ve started monitoring).
I used a rowing machine to exercise indoors at maximum intensity for 30 min., the same as my evening run. I did not develop a runny nose.
Based on these two observations and the fact that I’ve consistently gotten a runny nose on my morning walks for at least 3 weeks, it seems like the cause has to be either allergies or cold and exacerbated by physical activity.
To test the two hypotheses, I will run the following experiments:
Test 1: Walk while wearing an N95 mask both with and without the particulate filter.
The experiment will be randomized and blinded by having another person load/remove the filter
I will run 2 tests for each condition, recording whether or not I get a runny nose and it’s severity.
If I get the runny nose without the filter, but not with it, that strongly suggests the cause is allergies. If both conditions prevent a runny nose, that suggests the cause is temperature.
Test 2: Exercise (walk & run) after taking allergy medication
Take fast-acting allergy medication or a placebo 1 hour before exercising.
The experiment will be randomized and blinded by placing the pills inside of opaque gel caps and have another person randomize the treatment days for me.
If no effect is observed, take long-acting allergy medication or a placebo on alternating weeks.
I will run 3 tests for each condition, recording whether or not I get a runny nose and it’s severity.
During all experiments, I will record temperature, pollen count, and other notable weather conditions. If it is raining or unusually windy (very uncommon where I live), I will postpone the experiment to the next day.
These experiments will start next weekend, so I expect to have results to share in 3-4 weeks.
Previously, I proposed some analyses and breathing experiments to try to identify potential causes for and ways to reduce my high blood pressure. I got great feedback on that post (thanks everyone!) and have also done some preliminary breathing experiments. Based on that, I’ve finalized my experimental and analytical approach and am ready to start. This post will serve as the pre-registration of the experiments.
Details
Purpose
To identify environmental or controllable factors that have a significant impact on my blood pressure.
To quantify the effect of known interventions for reducing blood pressure.
To find a set of interventions that enable me to reduce my blood pressure below 120/80 mmHg.
Background
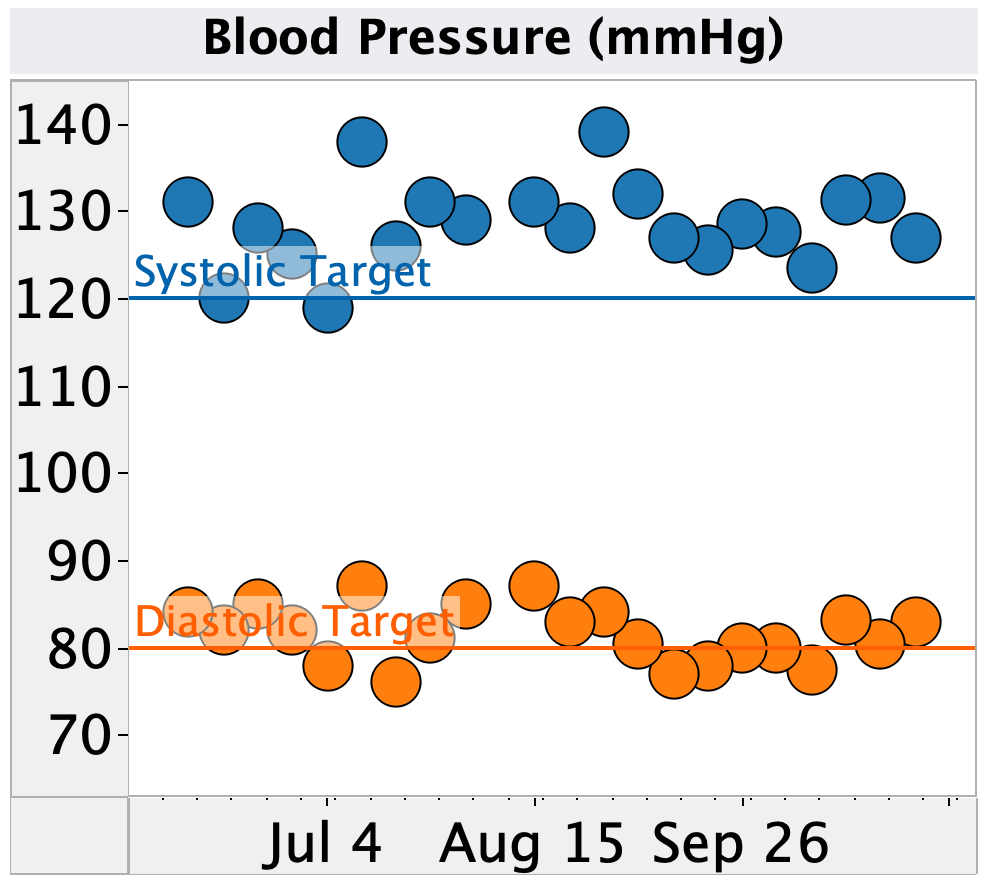
Figure 1. Weekly average of blood pressure as measured by Omron home blood pressure monitors.
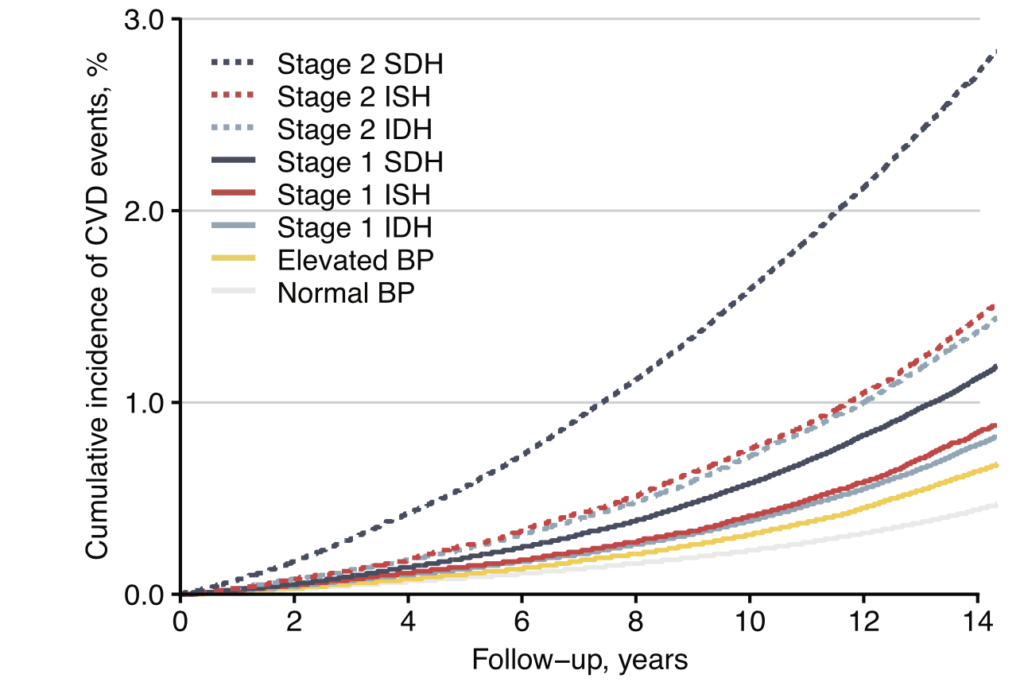
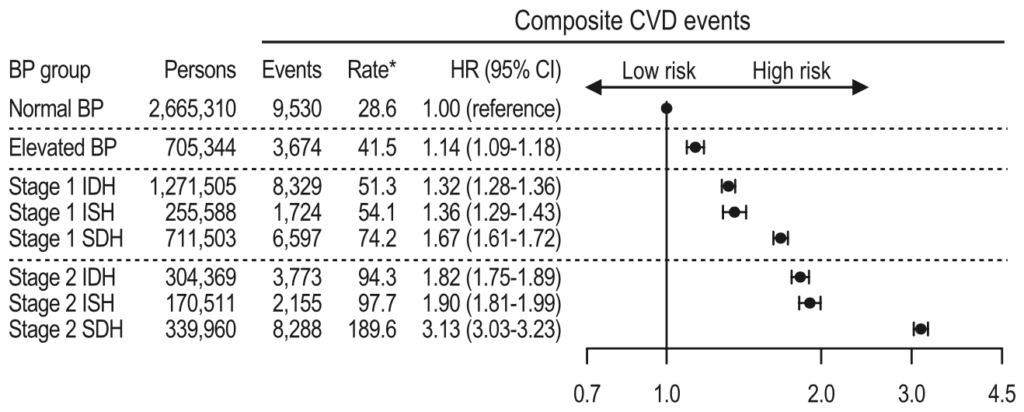
Figure 2. Cumulative incidence of cardiovascular disease vs. time for different blood pressure groups from a study of the South Korean nationwide health screening database (6.4M participants).
Table 1. Rate of cardiovascular disease for different blood pressure groups from a study of the South Korean nationwide health screening database (6.4M participants).
Given this, I’d like to see if I can reduce my blood pressure and reduce the strain on my heart and circulatory system.
There are numerous medications that lower blood pressure, but all risk of side effects. Before I pursue that route, I’d like to better understand the cause of my elevated blood pressure and see if any diet or lifestyle interventions can ameliorate it.
As mentioned above, I’ve been measuring my blood pressure for the past 4 months, along with blood glucose, sleep, weight, and exercise. This provides a (hopefully) rich dataset for identifying environmental or lifestyle factors that influence my blood pressure. Notably, I’ve noticed that my blood pressure is elevated on days after I’ve had low blood sugar the night before, indicating a possible effect (no statistical analysis done).
As a quick test of this approach, I did one-off tests of 7 different breathing protocols. I tested one each morning after arriving at work, measuring my blood pressure before and after the protocol. I used the app iBreathe to help regulate my breathing. The results are shown below.
Change in blood pressure following different breathing protocols. Protocols descriptors are Inhale Time (s)/Hold Time (s)/Exhale Time (s)/Hold Time (s), Total Duration (min.).
With the exception of one protocol (8s inhale/8s exhale for 5 min.), I did not see a significant drop in blood pressure. However, I saw a large rise in blood pressure (+7/+3 mmHg) when I did not use a breathing protocol. Given this, I think a more extensive experimental test, focused on the longer inhale/exhale time is worth trying.
Proposed Experiments
Phase 1: Identify Potential Causes of Elevated Blood Pressure from Existing Self-Tracking Data
Data
Blood pressure:
systolic and diastolic blood pressure
Measured by Omron Evolve
Glucose:
Same day: fasting BG
Previous day: average BG, time low (70, 60, & 50), time high (120, 140, 160), & coefficient of variation
Previous evening (after 7p): same as previous day
Measured by Dexcom G6
Sleep:
Time asleep, number of wake-ups, early rising (time woke before alarm)
Measured manually and by Apple Watch (less reliable but more data)
Other heart markers:
pulse (sleeping, morning, and awake), heart rate variability
Type of exercise the previous day (aerobic vs. strength training) and frequency of aerobic exercise
Manually recorded
Analysis
A mixed effect model will be used to calculate the effect size, standard error, 95% CI, and p-value for the correlation between each metric and systolic and diastolic blood pressure
Effects will be of significant magnitude if a reduction of 5 mmHg can be achieved via a practical variation in the correlating metric.
Given the large number of metrics being looked at, I will use p-value thresholds of:
0.02 for planning testing interventions
0.05 for follow up experiments to confirm the correlation
0.1 for further monitoring/assessment as I get more data
Phase 2: Testing Deep Breathing to Lower Blood Pressure
Background
Numerous studies, reviews, and meta-analyses have shown deep breathing to lower blood pressure in both the short and long-term (example 1, example 2).
Effect sizes are moderate (3-5 mmHg) and statistically significant for large patient populations (>10,000 patients in some studies).
Numerous breathing protocols have been tested, with varying results.
My own quick tests (see above) suggest a possible effect.
Approach
Measure blood pressure and pulse before & after the following protocols:
8s inhale, 8s exhale
Normal breathing (read and do not use app to regulate
Normal activity
Each protocol will be tested for 5 & 15 min.
Each protocol/time combination will be measured five times.
Conduct measurements 1/day in the mornings.
If any protocols show significant reduction in blood pressure (>3 mmHg), optimize the protocol and design/execute an experiment to test the long term effect.
Measurement
Blood pressure and pulse will be measured with an Omron Evolve.
Analysis
Student’s t-test will be used to test if the blood pressure change for any of the protocols is different from that of normal breathing.
These experiments will start this week, so I expect to have results to share in ~4 weeks.
About a week ago a reader, /u/genetastic, reached out about collaborating on experiments to determine the effect of vinegar on blood glucose after meal consumption.
Like most of you, I had heard all the nigh-magical, pseudoscience claims about using apple cider vinegar to treat diabetes. However, when you dig into the literature, there’s a sizable number of peer-reviewed studies, including several decent meta-analyses, showing that consumption of vinegar with a meal can reduce the blood glucose impact in both diabetic and non-diabetic subjects (see background below for details). There’s also a lot of open questions, including:
Is the effect large enough to matter for practical meals?
What types of meals does vinegar affect?
What is the best protocol to get a large effect without unpleasant side effects?
What’s the underlying mechanism?
Is the effect specific to vinegar or do other acids work?
/u/genetastic, a third collaborator /u/kabong, and I decided to answer these questions with community self-experiment.
Below, I give more details on the background literature and pre-register our protocol and analyses.
It would significantly improve the study to have a larger number of participants. If you’re interested in collaborating on this or other scientifically rigorous self-experiments with low-carb foods, supplements, or other health interventions, please let me know in the comments or via the contact form on the right.
Details
Purpose
To replicate (or fail to replicate) the existing literature and quantify the effect of vinegar on blood glucose level after consumption of complex carbohydrates.
To better understand the underlying mechanism by determining how this effect varies with person/metabolic status, dose, source of calories, and type of acid.
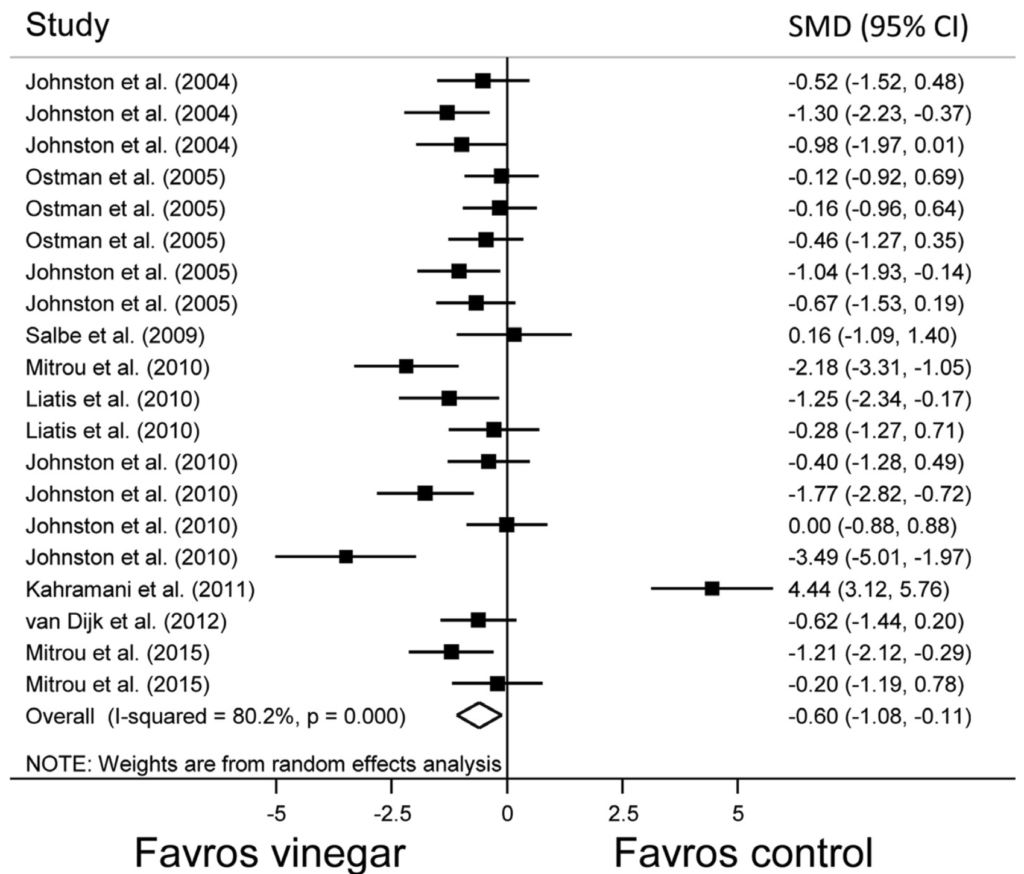
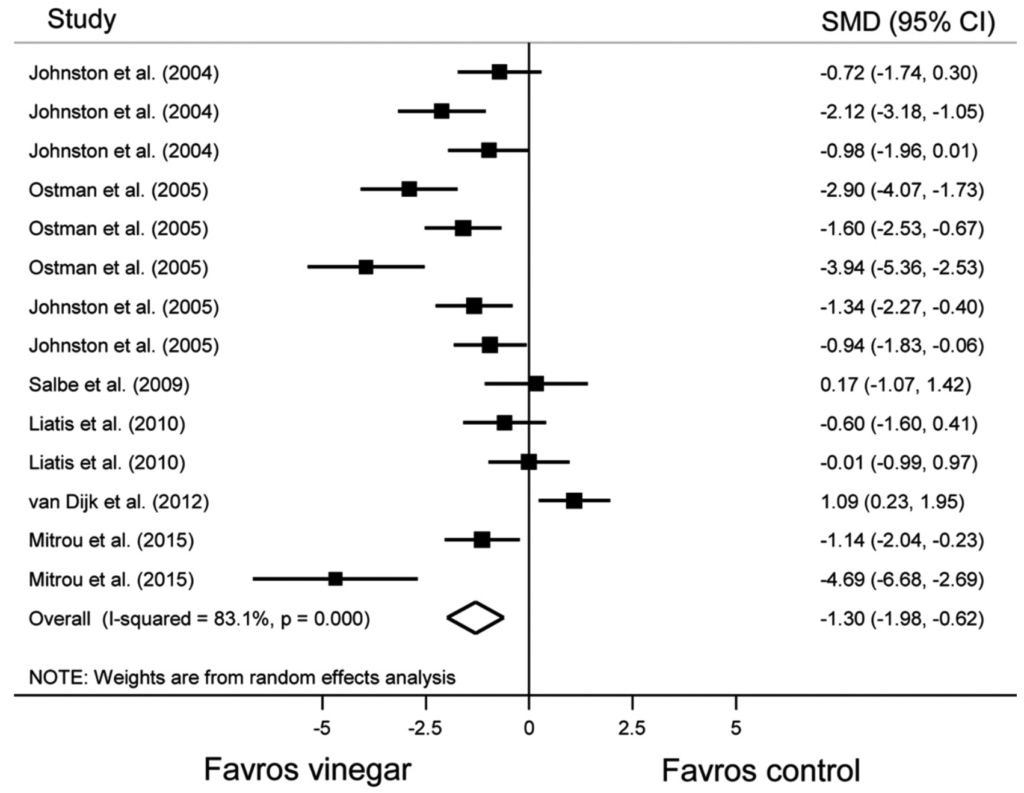
Figure 1. Forest plot showing individual and pooled random effect standard mean difference (95% CI) of trials testing the effect of vinegar on glucose area under the curve. Test of overall effect: z = 2.42, p = 0.01.Figure 2. Forest plot showing individual and pooled random effect standard mean difference (95% CI) of trials testing the effect of vinegar on insulin area under the curve. Test of overall effect: z = 3.73, p < 0.001.
All together this is decent evidence for the acid as inhibitor of alpha-amylase as mechanism hypothesis
One of the biggest challenges in the vinegar/acid literature is that all of the experiments were done with different meals, protocols, and doses, making it difficult to integrate data from multiple studies. To address this issue and answer some of the open questions about this effect, /u/genetastic, /u/kabong, and I decided to do a series of community self-experiments.
While we each have different motivations and interests, overall, the questions we’re looking to answer are:
Is the effect large enough to matter for practical meals?
What types of meals does vinegar affect?
What is the best protocol to get a large effect without unpleasant side effects?
What’s the underlying mechanism?
Is the effect specific to vinegar or do other acids work?
To answer these questions, we will be conducting experiments using the protocol below.
Methods
Materials
Meals:
white bread (starch)
dried dates (simple sugars)
tortilla with beans, salsa, & avocado (starch, fat, and protein)
Vinegar:
Apple cider or white vinegar
As large a quantity as comfortable, not to exceed 30g
Diluted in as little water as tolerable
Blinding
Vinegar supplementation will not be blinded
However, the protocol was established in advance and adhered to without modification once experiments started.
Procedure
Each participant is using a slightly different procedure