Last week, I reported my first attempt at reducing blood pressure using a deep breathing protocol. I saw a drop in blood pressure with deep breathing, but due to the high variance in the measurements, I couldn’t tell if this was a real effect or just due to chance.
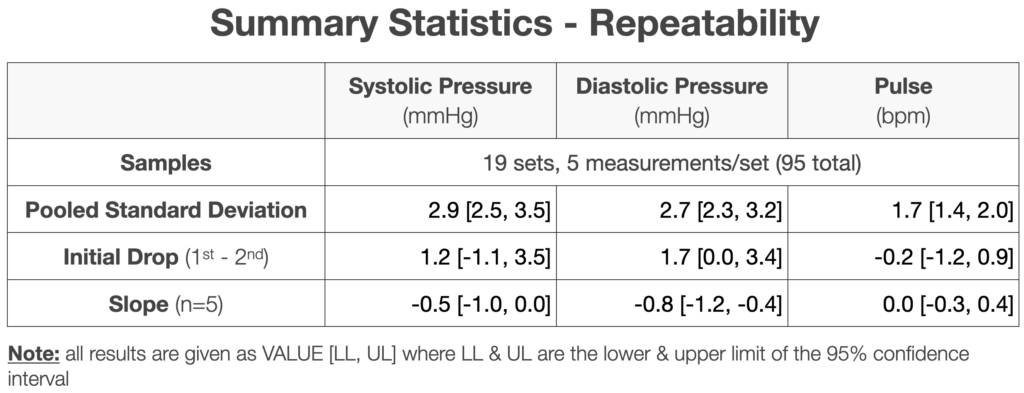
Based on my repeatability study, I’ve repeated the experiment, this time measuring my blood pressure 5 times for each observation. Here’s the result:
Summary
- Background:
- Numerous studies, reviews, and meta-analyses have shown deep breathing to lower blood pressure in both the short and long-term (example 1, example 2).
- Effect sizes are moderate (3-5 mmHg) and statistically significant for large patient populations (>10,000 patients in some studies).
- Numerous breathing protocols have been tested, with varying results.
- My own tests suggested a possible effect: first, second.
- Approach:
- Blood pressure and pulse were measured each morning before and after the following protocols:
- 8s inhale, 8s exhale, 5 min.
- Normal activity, 5 min.
- For each measurement, I took 5 readings and averaged the results.
- Protocols were alternated by day for 10 days (5 days each protocol).
- Average and 95% confidence intervals were compared for each metric & protocol.
- Blood pressure and pulse were measured each morning before and after the following protocols:
- Results & Conclusions:
- With additional, lower variance measurements, I did not observe a meaningful drop in blood pressure or pulse. For all metrics, the difference between deep breathing and normal activity overlapped zero effect and was lower than my target for “clinical” significance.
- While the variance is still too large to rule out a clinically significant effect size, it’s sufficiently unlikely that I’m not going to continue testing the short term effect of deep breathing.
- Next Steps:
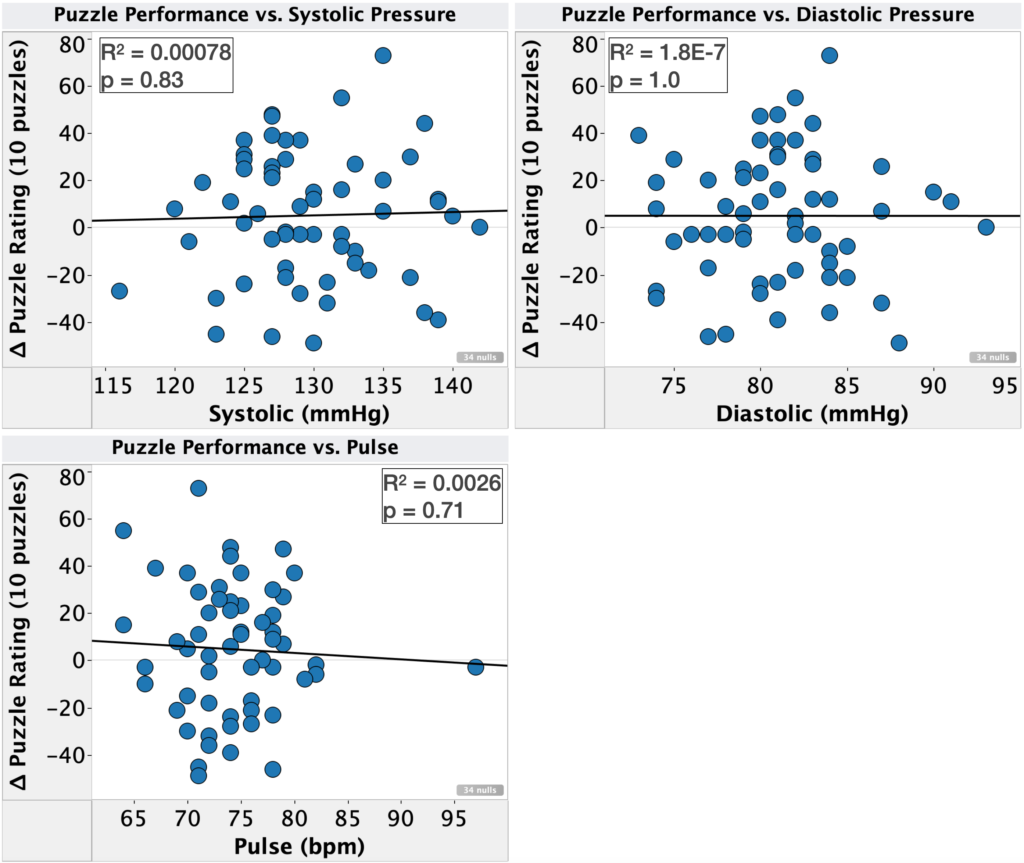
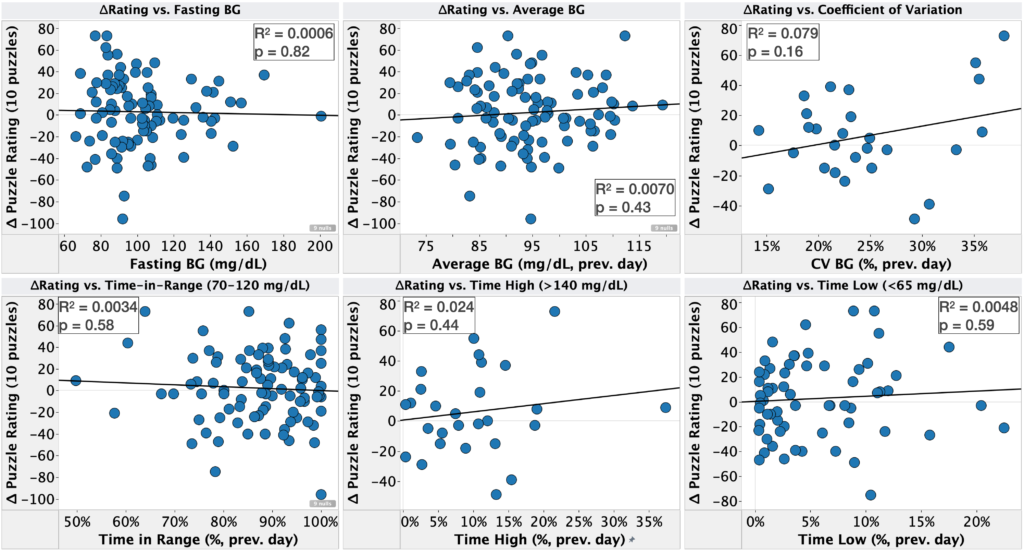
- Retrospective analysis of self tracking data
- I’ve finished the analysis and just need to write it up for posting.
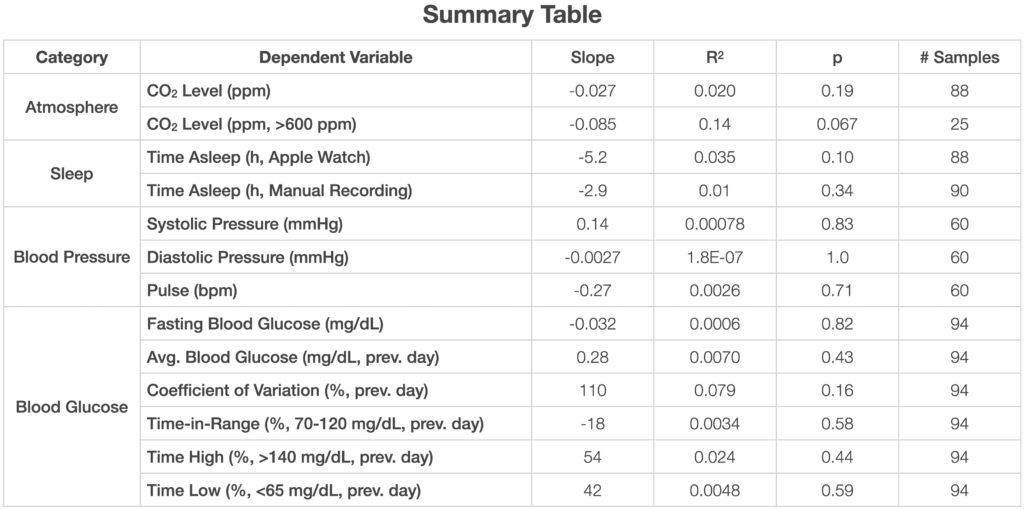
- There were no effects that were practically meaningful and statistically significant, but a few things were worth keeping an eye on.
- Inspiratory muscle training:
- On my last post u/OrganicTransistor suggested trying strengthening my respiratory muscles based on the results in this paper.
- I’m going to replicate their protocol as best I can (pre-registration to follow in another post).
- This study will take six weeks, but I will do an interim analysis every two weeks.
- Retrospective analysis of self tracking data
Details
Purpose
- To determine the effect of deep breathing protocols on short-term blood pressure.
Background
For additional background, see previous post.
- Numerous studies, reviews, and meta-analyses have shown deep breathing to lower blood pressure in both the short and long-term (example 1, example 2).
- Effect sizes are moderate (3-5 mmHg) and statistically significant for large patient populations (>10,000 patients in some studies).
- Numerous breathing protocols have been tested, with varying results.
- My own tests suggested a possible effect: first, second.
Results & Discussion
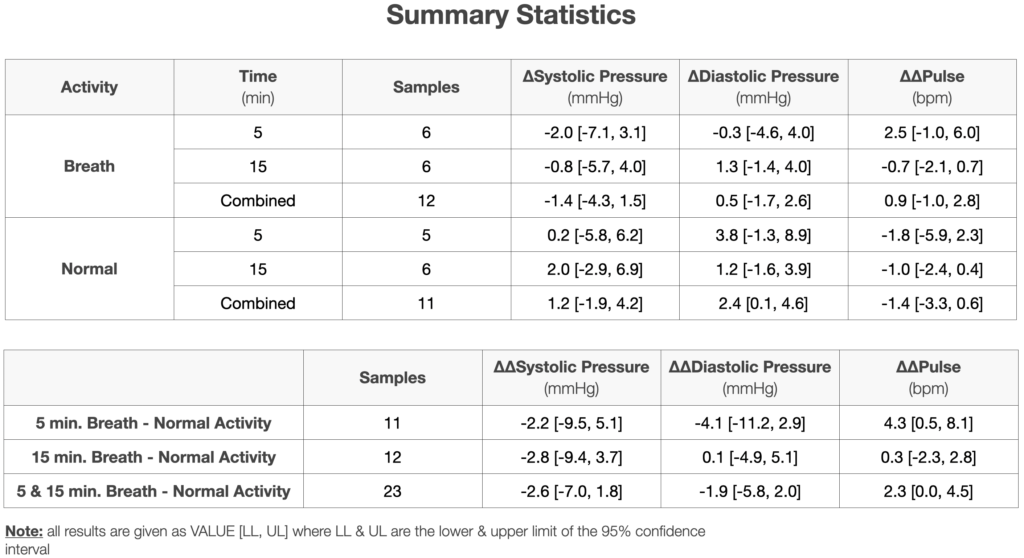
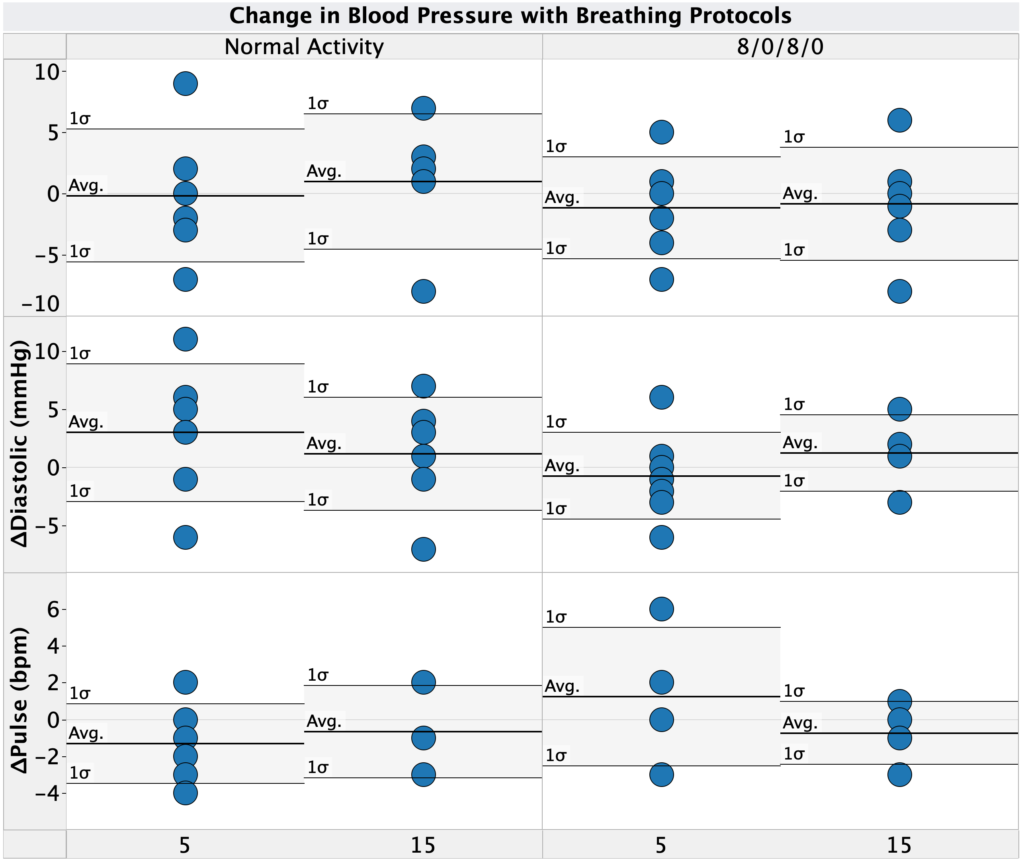
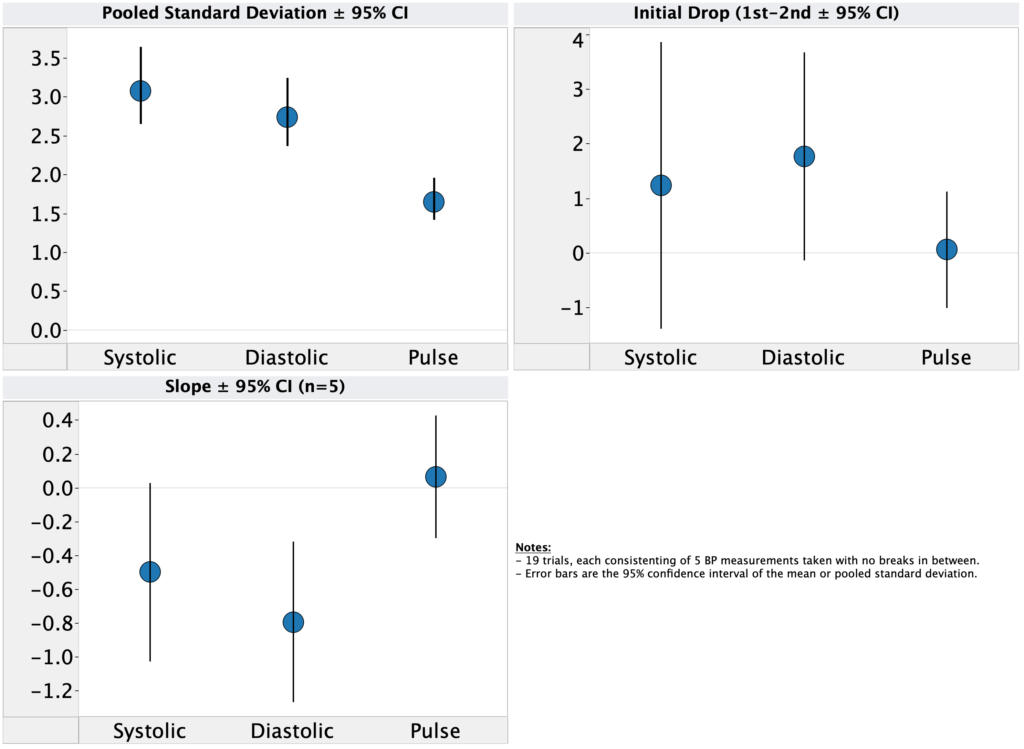
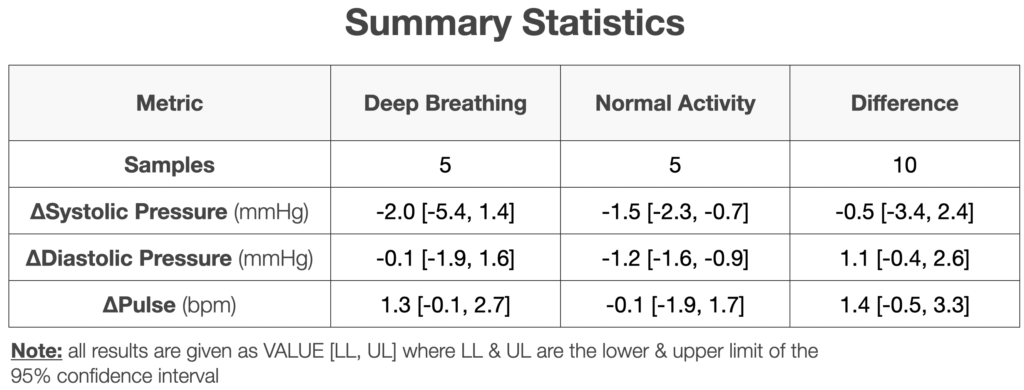
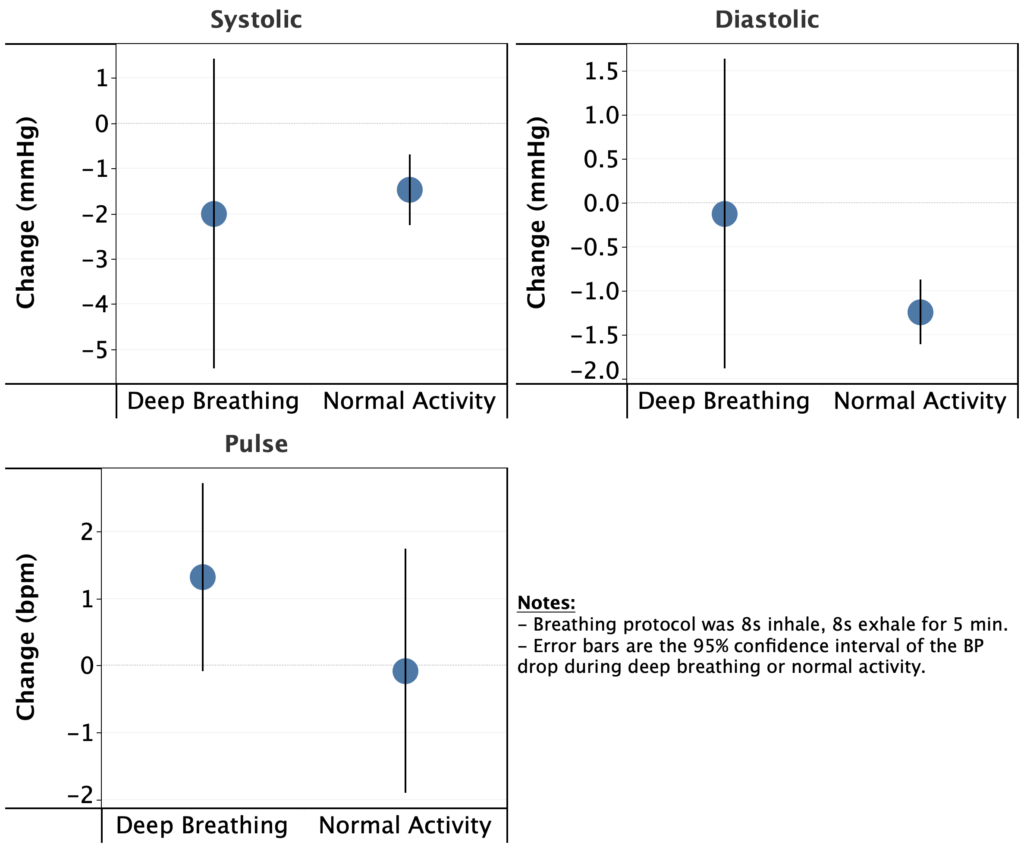
First, let’s take a look at the change in blood pressure for each protocol (deep breathing & normal activity). As shown in both the table and graphs above, on average:
- Systolic pressure dropped for both deep breathing and normal activity.
- In both cases, the magnitude was modest, 2.0 & 1.5 mmHg for deep breathing and normal activity, respectively.
- Since I took these measurements ~1h after waking up, this drop is presumably related to my morning routine in some way (e.g. dissipation of the initial stress from waking up, relaxing during morning computer work, etc.)
- Diastolic pressure was nearly unchanged with deep breathing (0.1 mmHg drop), but showed a modest drop for normal activity (1.2 mmHg)
- Pulse increased during deep breathing (1.3 bpm) and stayed the same during normal activity (0.1 bpm increase).
- Since I took these measurements ~1h after waking up, these effects, if real, are presumably related to my morning routine in some way (e.g. dissipation of the initial stress from waking up, relaxing during morning computer work, etc.)
- Several of these effects are different than my previous observations. Notably:
- I saw a drop in systolic and diastolic blood pressure in the normal activity condition vs. no change or increase previously.
- I saw an increase in pulse in the normal activity condition vs. a decrease previously.
- In no case was the difference outside of what would be expected due to the high variance in the previous experiments. As such, the differences are likely due to chance.
- Given the much lower variance in the current experiment (5 measurements per condition vs. 1) I have a lot more confidence in the current conclusions.
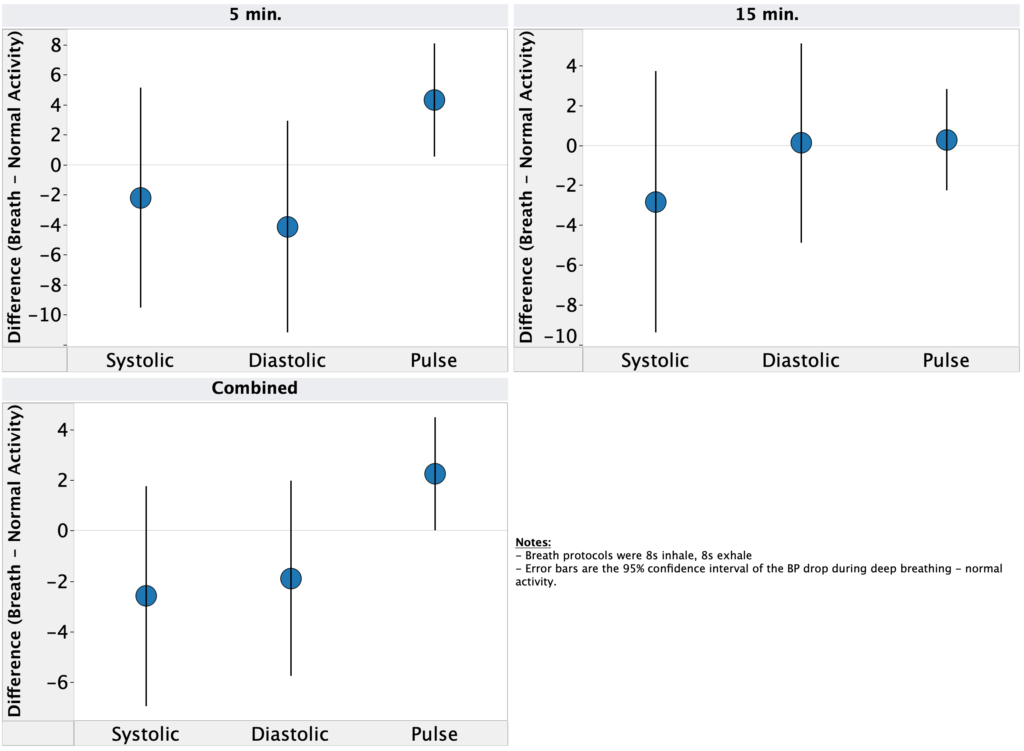
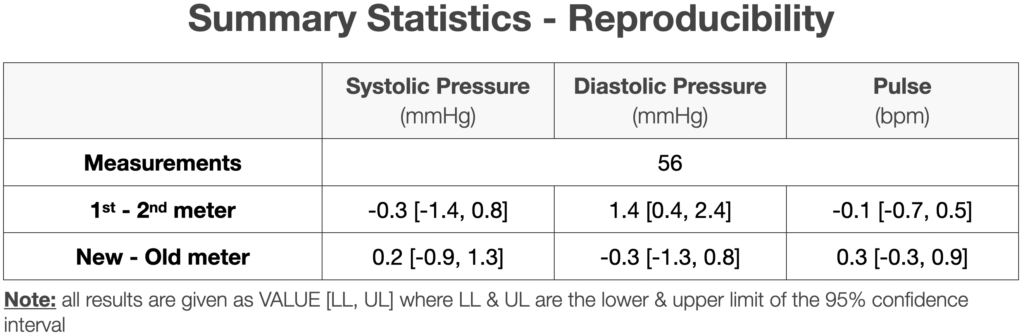
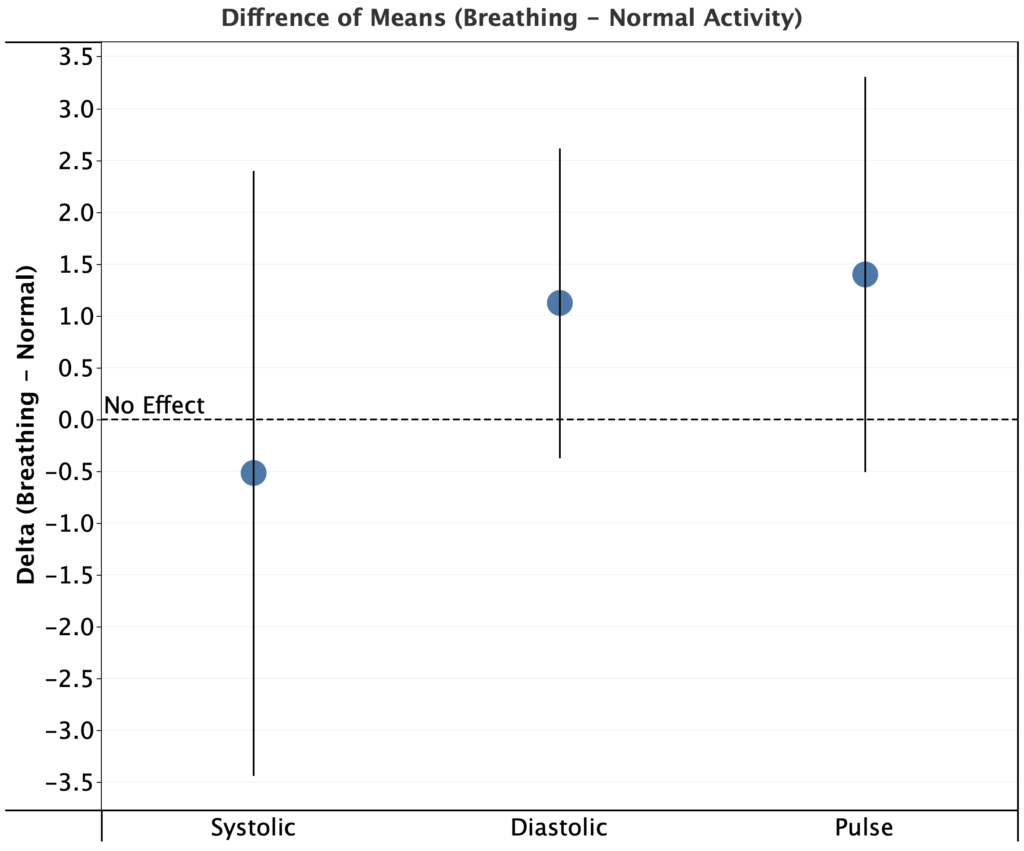
Looking at the difference between means (deep breathing – normal activity) for each metric, I see a decrease of only 0.5 mmHg for systolic pressure, an increase of 1.1 mmHg for diastolic pressure, and an increase of 1.4 bpm for pulse. In all cases, the 95% CI for the difference of means overlaps zero.
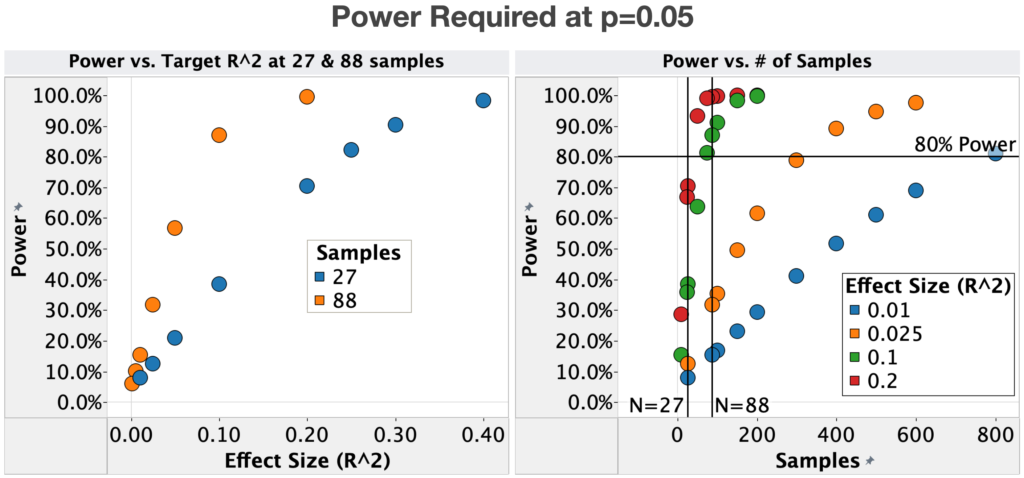
Since the measured effects are below my target for “clinical” significance and have a low probability of reaching the target with larger a sample size, it looks like deep breathing doesn’t meaningfully lower my blood pressure.
As mentioned in the background section, there are numerous published studies showing moderate effect sizes (3-5 mmHg) and statistically significant blood pressure drop during deep breathing for large patient populations. While my experiments indicate that this doesn’t work for me, it doesn’t mean the literature is mistaken. Some hypotheses:
- Most literature experiments were done in a clinical environment during the day. Due to the environment, the patients might have been more stressed, which can cause an increase in blood pressure and be mitigated by the deep breathing.
- My baseline stress may be lower than average and therefore methods to reduce stress (e.g. deep breathing) have a reduced effect on me.
- I breath more deeply during normal activity than average.
- Other natural person to person variation
- This is obviously a catch-all, but in the published studies, it was not the case that every patient showed a drop in blood pressure, just that there was a drop on average.
Conclusions & Next Experiments
It looks like deep breathing doesn’t meaningfully lower my blood pressure. The measured effects are below my target for “clinical” significance and have a low probability of reaching the target with larger a sample size.
Given that I’m not going to continue testing the short term effect of deep breathing on blood pressure. For my next experiments, I’m going to look at the following:
- Retrospective analysis of self tracking data
- I’ve finished the analysis and just need to write it up for posting. There were no effects that were practically meaningful and statistically significant, but a few things were worth keeping an eye on.
- Inspiratory muscle training:
- On my last post u/OrganicTransistor suggested trying strengthening my respiratory muscles based on the results in this paper.I’m going to replicate their protocol as best I can (pre-registration to follow in another post).
- This study will take six weeks, but I will do an interim analysis every two weeks.
- Increasing my Potassium:Sodium ratio
- Still figuring out how to test this in a rigorous way. Will pre-register as soon as I work it out.
– QD
Methods
Pre-registration
Differences from original pre-registration:
- Instead of using students t-test, I compared 95% confidence intervals between conditions (mathematically equivalent for a threshold of p = 0.05)
Blinding
This experiment was not blinded
Procedure
- Each morning at ~6am, I measured my blood pressure before and after the following protocols:
- 8s inhale, 8s exhale, 5 min.
- Normal activity, 5 min.
- Breath timing was controlled using the iBreath app.
- Blood pressure measurements were performed using an Omron Evolve blood pressure meter.
- For each measurement, I placed the meter on my left arm, ~4 cm above my elbow. Measurements were taken seated, with my feet on the ground and arms resting on a flat surface at a comfortable height (same every time).
- 5 measurements were taking with no pause in-between measurements (other than to write down the result) and the average of the 5 measurements was used.
Data Visualization
Data was visualized using Tableau.