Get new posts by email or rss feed
This post is an update on my experiments measuring the effect of low-carb foods and dietary supplements on blood sugar.
This week, I have the results from low-carb breads. Next week I’ll be posting results from commenter requests, followed by chocolate.
Testing Queue:
- Prepared foods:
- Tortillas: Reported
- Cereal: Reported
- Ice Cream: Reported
- Bread: This post
- Meal replacements: in queue, (Ketochow reported)
- Snack bars: in queue
- Chocolate: in queue
- Ingredients:
- Flour replacements: in queue
- Seeds & nuts: in queue
- Vegetables: in queue
- Supplements:
- Vinegar: In queue
- MSG: Reported
Bread
Summary
One of the most difficult foods to make low carb is bread. Flour imparts multiple functions to the final product: taste, texture, water absorption, cohesion (via gluten), browning, food for yeast, etc. There are numerous good substitutes for one or the other of these properties, but to get them all, you’d need a complex combination of ingredients.
Recently, there’s been an explosion of commercially available low carb products both on-line and at supermarkets, including a number of low carb breads. Although the net carb counts look good for most of these, I’ve become very suspicious of the blood sugar impact of some of the dietary fibers used (see evidence of blood glucose impact of dietary fibers here & here).
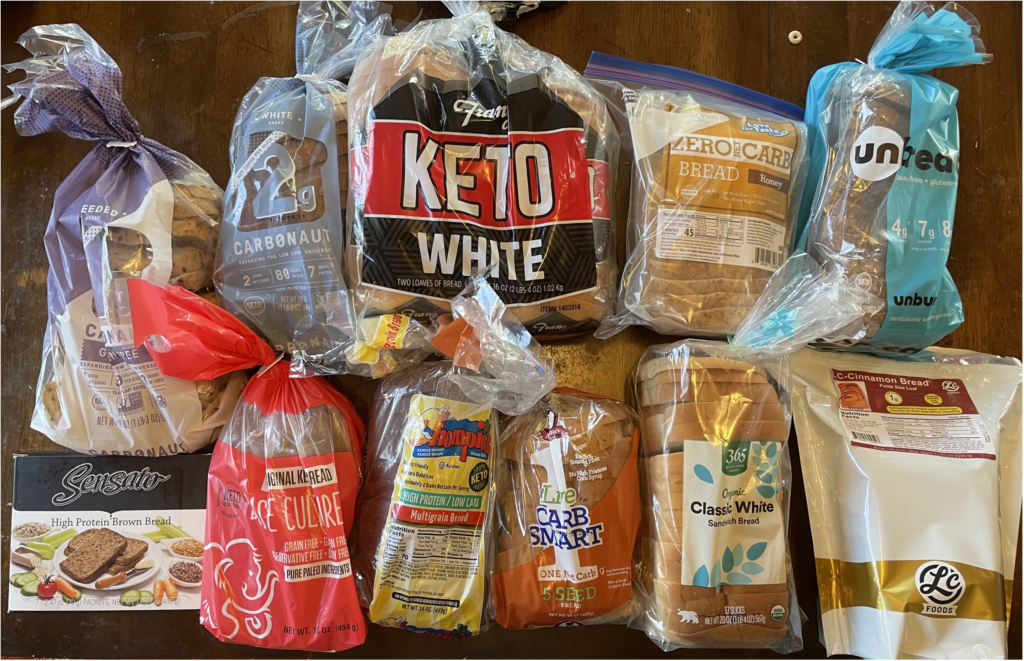
To see if any of these low-carb breads would hold up, I tested them myself. I tested 14 breads from 4 different categories (resistant starch, protein & flour or fiber, and egg & nut), plus regular white bread as a control.
This was the most interesting of my prepared food studies so far. There was a huge variation in taste, texture, and BG impact and some mysteries that I’ll need to unravel (what’s going on with the resistant starches?).
Here’s my overall conclusions:
- Lowest BG impact: UnBun UnBread
- <10% BG impact of regular white bread; <50% of the next best
- Best combination of taste & impact: Carb0naut White & Kiss My Keto Golden Wheat
- ~25% BG impact of regular white bread
- Very different taste & texture, but both really good
- There’s a large range in impact from different resistant starches.
- No idea what’s going on here, but I’m very curious. Maybe I should source/test different resistant starches and see how their BG impact varies.
- Does anyone have any hypotheses? If so, please let me know in the comments.
- BG impact is not easy to predict from the primary ingredients or nutrition label due to not knowing the ingredient ratios. Breads with actual flour can have the same impact as ones with indigestible fibers and two breads with the same total and/or net carb count can have wildly different impact.
- The only way for me to know the impact of a food is to do a controlled test.
- For someone without diabetes, this would probably require eating a large amount, as you’d need to induce an BG rise (since an insulin spike wouldn’t be measurable).
Does anyone know any other good low-carb breads or other low-carb foods I should try?
As always, please let me know if you have any thoughts, suggestions, or anything else you’d like to see me test.
– QD
Details
Purpose
- To identify low-carb foods that taste good and have minimal effect on my blood glucose.
- To determine the effect of popular, literature supported dietary supplements on my blood glucose.
Background
One of the most difficult foods to make low carb is bread. Flour imparts multiple functions to the final product: taste, texture, water absorption, cohesion (via gluten), browning, food for yeast, etc. There are numerous good substitutes for one or the other of these properties, but to get them all, you’d need a complex combination of ingredients.
Recently, there’s been an explosion of commercially available low carb products both on-line and at supermarkets, including a number of low carb breads. Although the net carb counts look good for most of these, I’ve become very suspicious of the blood sugar impact of some of the dietary fibers used (see evidence of blood glucose impact of dietary fibers here & here).
To see if any of these low-carb breads would hold up, I tested them myself.
Design/Methods
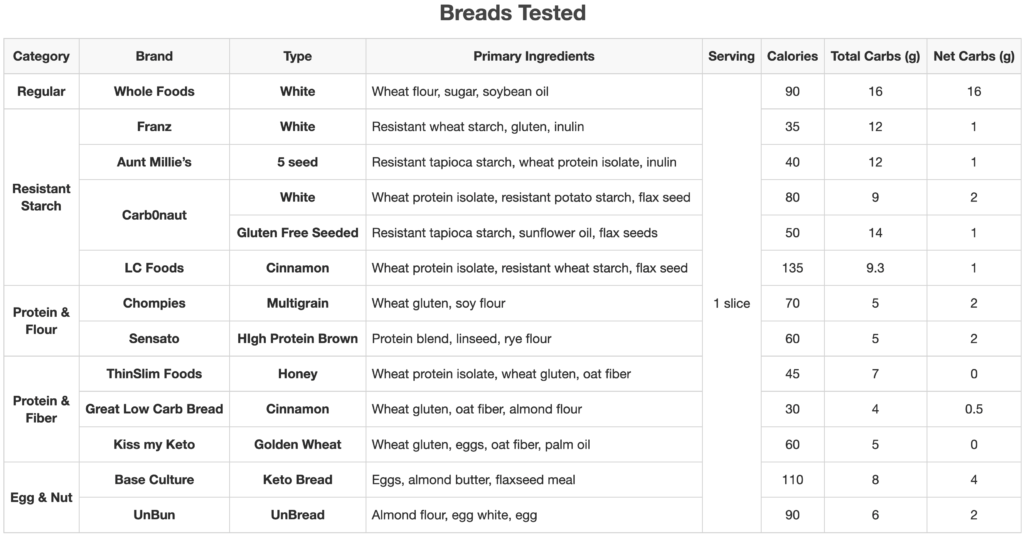
Foods. I tested 14 breads from 4 different categories (grouped by main ingredients), plus regular white bread as a control:
- Resistant Starch
- Protein & Flour
- Protein & Fiber
- Egg & Nut
Full nutrient and ingredient info here. Key nutrition facts in the table below.
Procedure. At 5:00a, I took 4.5u of Novolog (fast acting insulin, duration of 2-4h), then drank a Ketochow shake (website, BG testing) at 5:30a. After that, no food or calorie-containing drinks were consumed and no exercise was performed. Non-calorie-containing drinks were consumed as desired (water or caffeine-free tea). At 10:30am-12 pm, the substance to be tested was eaten as rapidly as comfortable and notes on taste and texture were recorded (before observing any change in blood sugar).
Blood sugar was monitored for 5h using a Dexcom G6. Calibration was performed 15-30 min. before the start of each experiment.
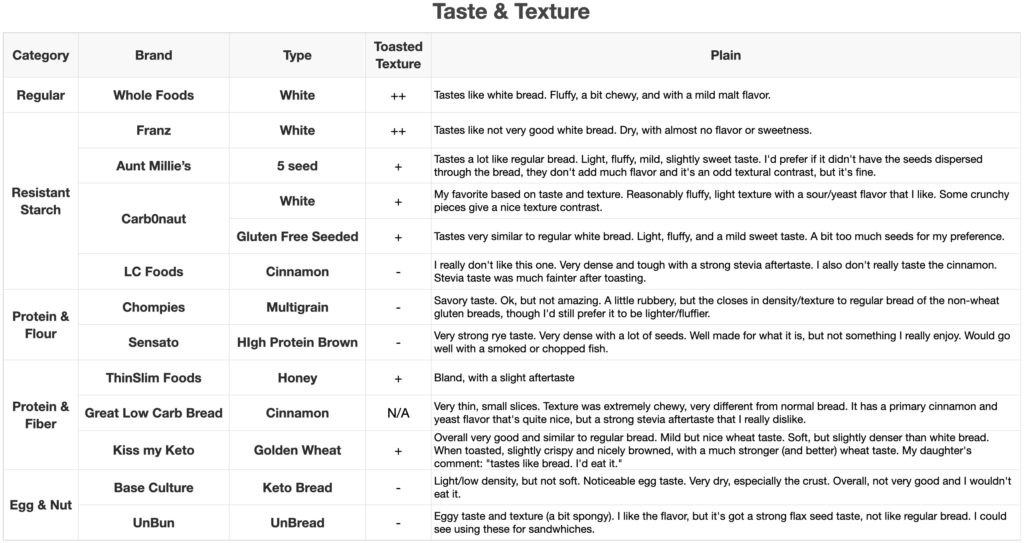
Separately, all breads were toasted using a Brava oven (wheat toast, setting 7). Taste and texture were recorded.
Data Processing & Visualization. iAUC was calculated using the trapezoid method (see data spreadsheet for details). Data was visualized using Tableau.
Medication. During these experiments, I took long-acting basal insulin each evening at 9pm (Lantus, 1.5u) and 2000 mg of metformin and multivitamin each morning at 5am. I did not dose for the experimental food ingested.
Data
- Formatted raw data, peak blood glucose, iAuC, and time to peak data
- Summary data, ingredient details, and taste assessments
Results & Discussion
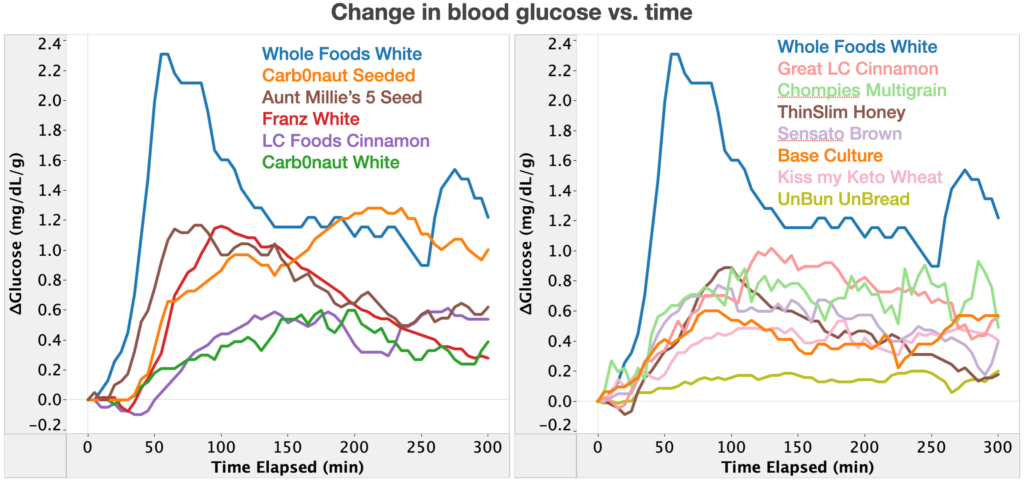
There’s a lot of data here and large variations between categories & brands. To keep things organized, I will split the discussion up by category.
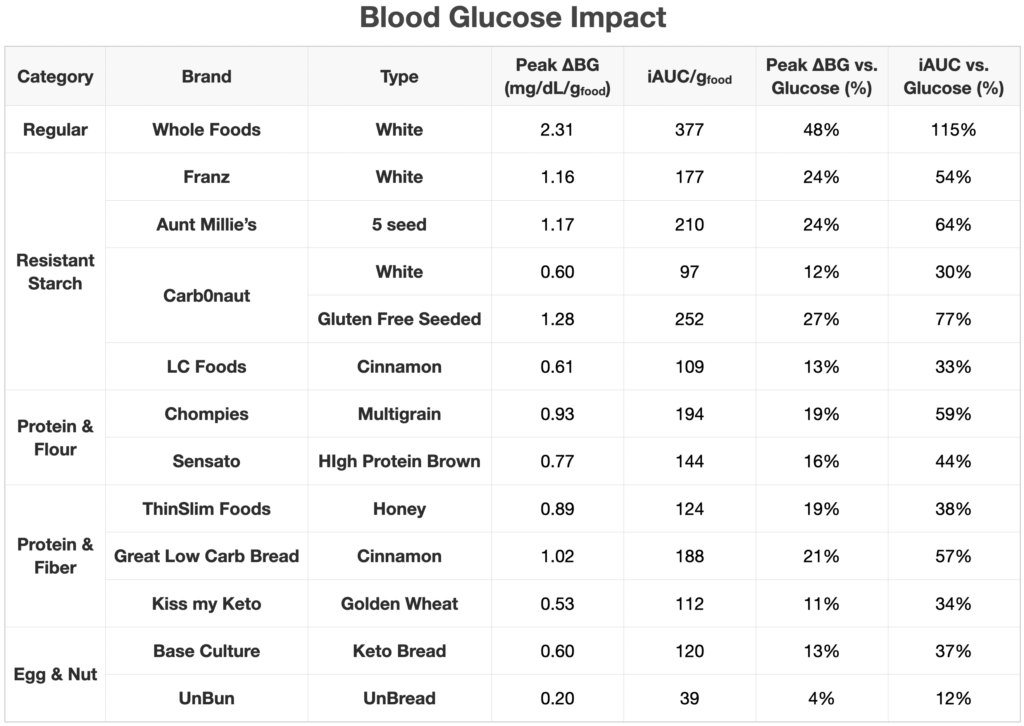
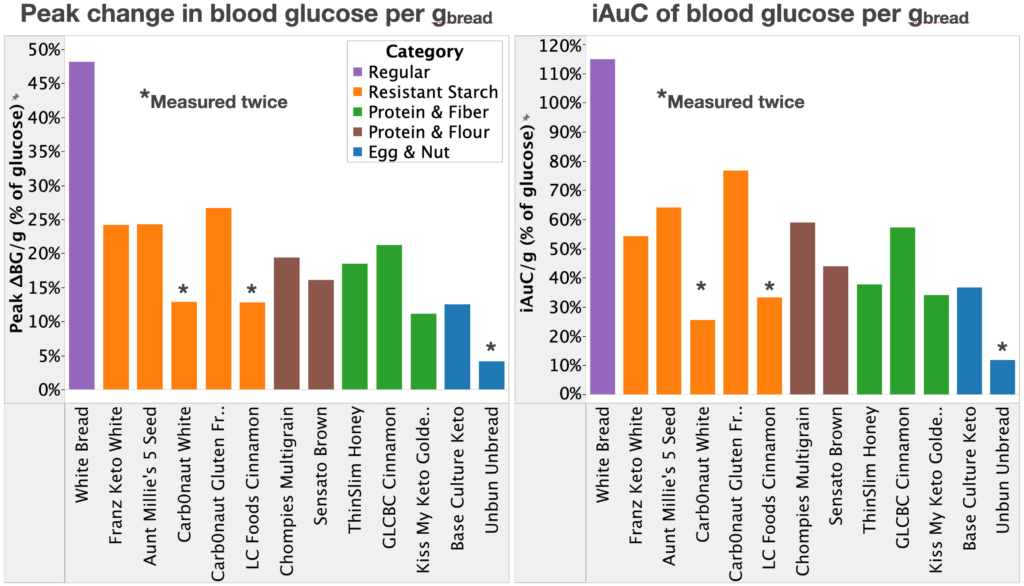
Control/Regular White Bread. In order to have a basis for comparison, I tested regular white bread from Whole Foods. Results for this were as expected, with a peak ∆BG of 48% and iAuC of 115% of glucose, consistent with my previous observations for starches.
Resistant Starch. The majority of the low-carb breads I found used some variant of resistant starch as their main ingredient (wheat, tapioca, or potato). Since I’ve previously observed resistant wheat starch to have a large impact on my blood sugar both alone and in tortillas, I suspected these would have a high impact as well.
3/5 resistant starch breads gave the expected results, with peak ∆BG of ~25% and iAuC of 55-75% of glucose, almost identical to what I observed for tortillas made from resistant starch. This is about half as much as regular white bread and pretty useless on a low-carb diet.
Surprisingly, two of the breads, Carb0naut White and LC Foods Cinnamon, had much lower BG impact, coming in at a ∆BG of ~13% and an iAuC of ~30% of glucose, or about a quarter of regular white bread. Because of the large difference between these and every other resistant starch containing food I’ve tested, I repeated both measurements. In both cases the repeats were similar.
Looking at the ingredient lists, I can’t figure out any reason why these two breads would be so different. The Carb0naut white is the only one that uses resistant potato starch, but the LC foods uses resistant wheat starch, which is in many of the others. The only thing I can think of is that they either use different brands of resistant starch that are less digestible or use a very different ratio of ingredients.
Does anyone have any other hypotheses or know of any studies showing a varying BG impact for different kinds of resistant starches? If so, please let me know in the comments.
With the exception of the LC Foods cinnamon, taste and texture of the resistant starch breads were very similar to white bread, light, fluffy, and with a very mild flavor. Happily, the Carb0naut White, which has the best BG impact, also had the best taste, with a mild sour/yeast flavor that I really liked and some crunchy pieces for a nice textural contrast. The LC Foods cinnamon was really dense and tough, with a strong stevia aftertaste that I really disliked.
All of these breads, except the LC Foods, became crispy when toasted while remaining soft inside.
Protein & Flour and Protein & fiber. The second largest category of breads used a combination of protein (gluten & various isolates) and some combination of lower carb flours (soy, linseed, rye) or oat fiber as their main ingredients. With the exception of the Kiss my Keto brand, these had very similar BG impact, coming in at a ∆BG of ~15-20% and an iAuC of ~37-60% of glucose, slightly better than the resistant starch breads, but not great.
Kiss my Keto came in lower than the rest, with a ∆BG of 11% and an iAuC of 34% of glucose, 20-30% of white bread. It’s not clear from the ingredients why this one is lower than the other protein & fiber breads, but it could easily be explained by differences in the relative ratio of the protein and fiber or the specific gluten used.
Taste, texture, and effect of toasting varied widely for these breads, see the taste & texture table for details. The most interesting was the Kiss my Keto bread, which tasted extremely similar to regular wheat bread. It also was the most improved by toasting, developing a much stronger wheat taste that I really liked. Kiss my Keto has several other flavors, including a cinnamon raisin with a slightly higher carb count. The cinnamon raising is fantastic; dense, chewy and slightly sweet. Would be perfect for french toast. I’m definitely going to get it once in a while as a “treat”.
Egg & Nut.The category used a combination egg and either nut butter or nut flour as their main ingredients. These had the lowest BG impact, with Base Culture coming in similar to Kiss my Keto and UnBun coming in at an impressive ∆BG of 4% and an iAuC of 12% of glucose, <10% that of regular white bread (measurement repeated to confirm).
Again, I can’t tell the reason for the discrepancy from the ingredients, but it’s probably due to ingredient ratios.
In terms of taste, both of these had a noticeable egg taste and a texture very different from regular bread. The Base Culture was very dry and I didn’t like it at all, but the UnBun was soft with a nice flax seed flavor. Pretty different from regular bread, but it was ok. I also tried the UnBun buns, crusts, and tortillas and I liked those much better (especially the buns). I won’t be getting the bread again, but will probably include the buns as an occasional part of dinners.
Thoughts & Next Experiments
This was the most interesting of my prepared food studies so far. There was a huge variation in taste, texture, and BG impact and some mysteries that I’ll need to unravel (what’s going on with the resistant starches?).
Here’s my overall conclusions:
- Lowest BG impact: UnBun UnBread
- <10% BG impact of regular white bread; <50% of the next best
- Best combination of taste & impact: Carb0naut White & Kiss My Keto Golden Wheat
- ~25% BG impact of regular white bread
- Very different taste & texture, but both really good
- There’s a large range in impact from different resistant starches.
- No idea what’s going on here, but I’m very curious. Maybe I should source/test different resistant starches and see how their BG impact varies.
- Does anyone have any hypotheses? If so, please let me know in the comments.
- BG impact is not easy to predict from the primary ingredients or nutrition label due to not knowing the ingredient ratios. Breads with actual flour can have the same impact as ones with indigestible fibers and two breads with the same total and/or net carb count can have wildly different impact.
- The only way for me to know the impact of a food is to do a controlled test.
- For someone without diabetes, this would probably require eating a large amount, as you’d need to induce an BG rise (since an insulin spike wouldn’t be measurable).
As always, please let me know in the comments if you have any thoughts, suggestions, or anything else you’d like to see me test.
– QD
Try Sola Bread.
Hi, are you going to repeat with new additions like Sola or Hero brands? I’ve tried the Hero and the slices and hot dog buns are great, going they’re not too horrible since they’re resistant starch also.
Not sure if I’m going to go back and do a rigorous test, but I tried the Sola brand during my original experiments and found it to be similar to other common resistant starches. In other words, about half the BG impact of regular bread, but much higher than the net carb count would suggest.
This is excellent!
Thanks for going to n = 2 on the lowest breads. Very interesting to see that your results are repeatable! Have you done n > 1 on any of the other tests? Sorry I haven’t scanned every experiment with that in mind.
I only went back and repeated on things I enjoyed and wanted to eat regularly. For the breads, that was the carbonaut and unbun brands, which I’ve had many times since the original testing and always gave consistent results.
Hi. Thanks for all that work!!! There’s another bread on the market – Inked Keto.
I wish there was some sort of testing for all of these breads. I remember Julian Bakery (pretty sure) was giving out wrong stats on their LC bread some years ago.
UnBun looks pretty good – maybe I’ll try to find it.
Again, thanks for your efforts.
Looks Inked is made with resistant wheat starch. Virtually everything I’ve tried with that had a huge blood sugar impact, with the exception of Carbonaught. I’d be very surprised if it was zero impact.
My RD hypothesizes that carb counts on many keto breads may be misleading. If I recall, she figured they may round up on the fiber/other “deductible” carbs (e.g. display 9.53 g fiber as 10 grams), round down on total (e.g. 11.47 total appears as 11 grams total carbs), then display a misleading net number of carbs. 11.47 total – 9.53 g fiber = 2.94 grams carbs but display 11-9 = 2. That’s a huge difference for some people, such as those on medical ketogenic diets with very low carb counts – often 20 grams net for adults. For the sake of example, you’re supposed to be under 6 grams/meal and think you’re having 4 grams in 2 slices of bread but really you’re having 5.88 grams – an extra 10% of your daily carbs you don’t even know about.
Add a handful of chopped green onion (0.3 g), a few lettuce leaves (0.1), and 2 thin slices of tomato (0.8) to your meat/cheese (0.6) sandwich and you’ve blown that number out of the water. Total: ~ 7.7 grams instead of intended/believed 5.7.
It’s definitely true that the nutrition labels are rounded. You can often see that by looking at the Chronometer entries or USDA nutrition facts for larger quantities. It makes it more readable for the average consumer, but really sucks for people who are carefully counting their macros or are insulin-dependent diabetics…
I’m curious if there will be an update with more breads added? I’m trying to find some info on Unbun Complete Protein Bread (extra protein, nut free, still high fiber) but I’m only seeing results for their Unbread, which is apparently different and based on almonds and eggs. I’d love to know how it fares taste wise and blood sugar wise! Thank you for publishing your other findings so far, it is very helpful! 🙂