I don’t have enough data yet to analyze my food & exercise experiments (see next experiments), so for this week I decided to look at how my blood sugar varies over the course of a day.
Normally, I only check my blood sugar at key times (waking, going to bed, before injecting insulin, before eating, and 1 & 2h after eating). To see if there was anything to be learned from what’s happening the rest of the time, I decided to spend 2 days checking my blood sugar every 15 minutes.
Since I have Type 2 diabetes, my insurance won’t cover a continuous glucose monitor (CGM). Plus, blood glucose meters (BGM) are more accurate, even according to CGM manufacturers. So, for this experiment, I used my Freestyle Freedom Lite and just measured by blood glucose every 15 minutes.
This ended up being way more useful than I expected. There was a lot more going on between the times I usually measure than I realized. Here’s a most important things I learned, my new questions, and ideas for next experiments.
Key Learnings:
- Shorter testing intervals around key times is extremely informative. My normal routine of testing blood sugar before and 1 & 2h post-meals is not sufficient. There’s a lot going happening on both shorter and longer time-scales that will be useful for understanding the effects of different interventions and for optimizing medication.
- I’m spending far more hypoglycemic than I had realized, most notably when I exercise.
- My peaks in blood sugar from breakfast and lunch occur >3h post-meal and persist until my next insulin dose. This is way longer than I expected and indicates that I need to switch to a longer acting insulin or change something about the meals.
- My blood sugar drops significantly during cardio exercise (MMA, biking), then returns to normal over 30-45 min. I need to find a way to mitigate this to prevent my blood sugar from going dangerously low.
Questions:
- What is happening to my blood sugar between waking and breakfast? Any risk of hypoglycemia while driving to work?
- Is the long-duration peak in blood sugar after breakfast and lunch real & consistent? If so, what causes it and can it either be shortened by modifying the meal or mitigated using a longer-acting insulin?
- What is the effect of different types of exercise? How can I mitigate or offset the initial drop in blood sugar during cardio without causing high blood sugar after the recovery?
- What is the effect of dinner, disentangled from exercise?
Next Experiments
I’m always interested in ideas for new experiments, so please leave a comment if there’s something you’d like me to try.
- Exercise studies: Measure blood glucose at 15 min. intervals for different duration and intensity bike rides and weight lifting. Also try varying time since last insulin dose and food eaten before exercising.
- Long peak from breakfast & lunch: Measure blood glucose at 15 min. intervals a few more times after breakfast & lunch. Try varying protein and fiber content to see if those are the causes. Try normal-acting insulin to mitigate.
- Food & medication studies: It’s proving difficult to disentangle the numerous effects going on at any given meal by adding or subtracting particular foods (data too noisy, too many measurements required to observe a statistically significant effect). Instead:
- Skip meals and medication to measure background trends.
- Consume individual ingredients (glucose, protein, fiber, etc.) or take individual medications to measure their direct effects.
- Measure combinations of ingredients and medications to measure interaction effects.
- This will require more experiments, but I think in the end it will require less time & effort to get reliable results.
Details
Purpose
To better understand trends in my blood glucose over the course of a day and determine if there are trends or events that I should investigate further.
Design/Methods
General. Blood glucose was measured approximately every 15 min. using a FreeStyle Freedom Lite glucose meter and FreeStyle lancets & test strips. No special precautions were taken to clean the lancing site before measurement. To take a sample, the lancing devices was used to pierce the skin at an ~45 deg. angle from the finger. Blood was then squeezed out by running the thumb and pointer finger of the opposite hand from the first knuckle to the lancing site of the finger. Blood was then wicked into a test strip that had been inserted into the meter and the glucose reading was recorded.
Medication and meals were kept as normal, with the exception of an additional 2 g of glucose eaten with breakfast on the first day as part of an experiment on the effect of glucose on my blood sugar.
Data
Results & Discussion
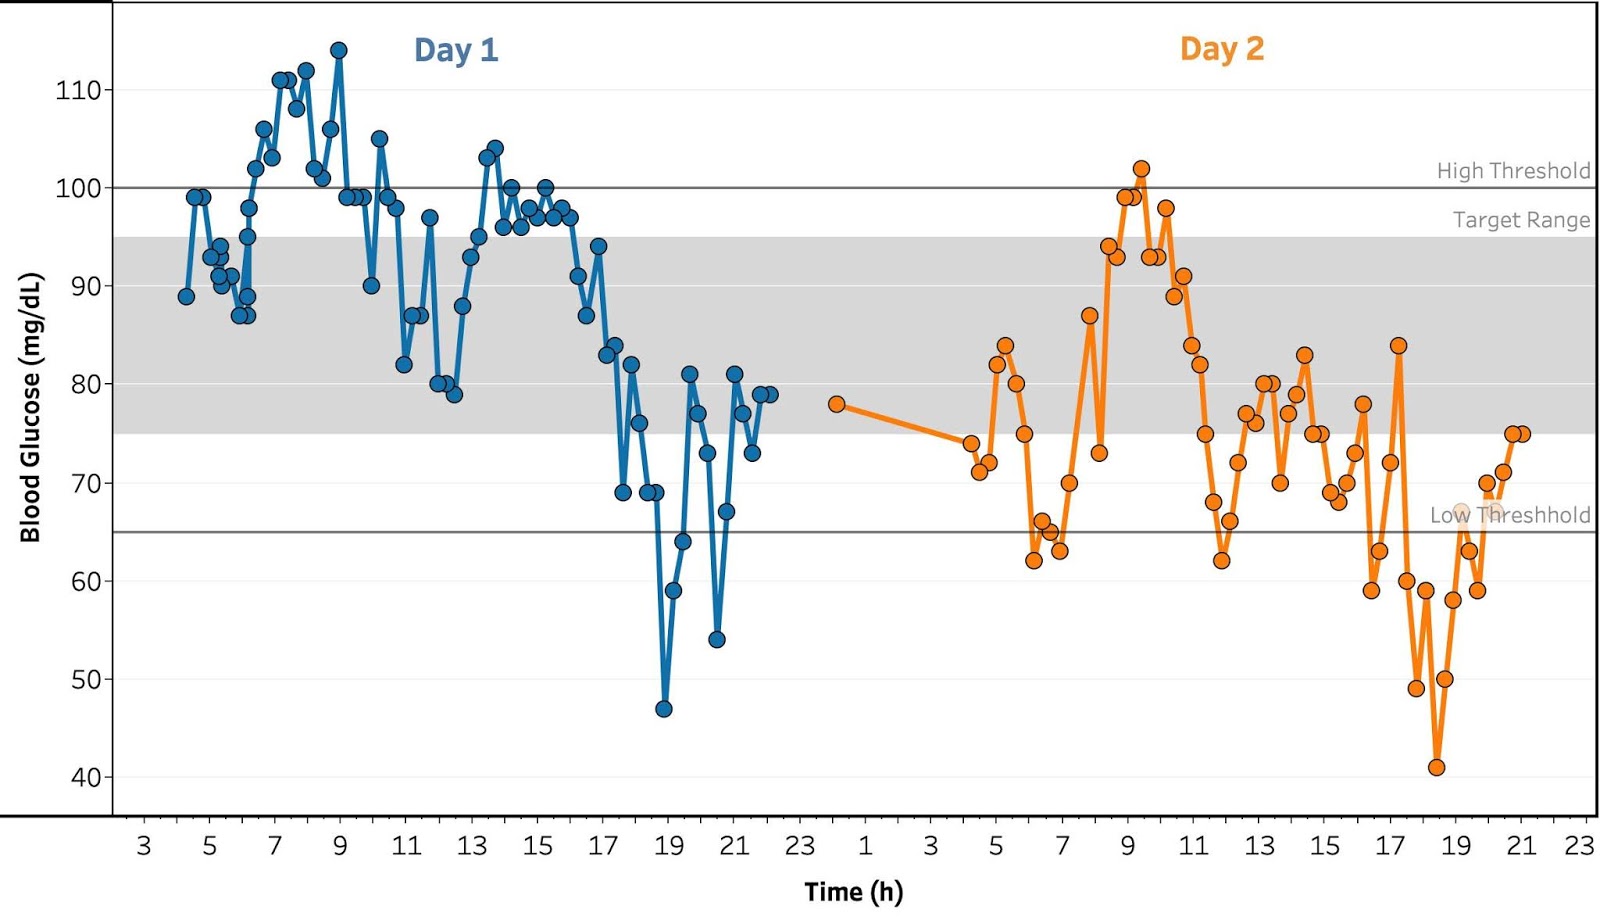
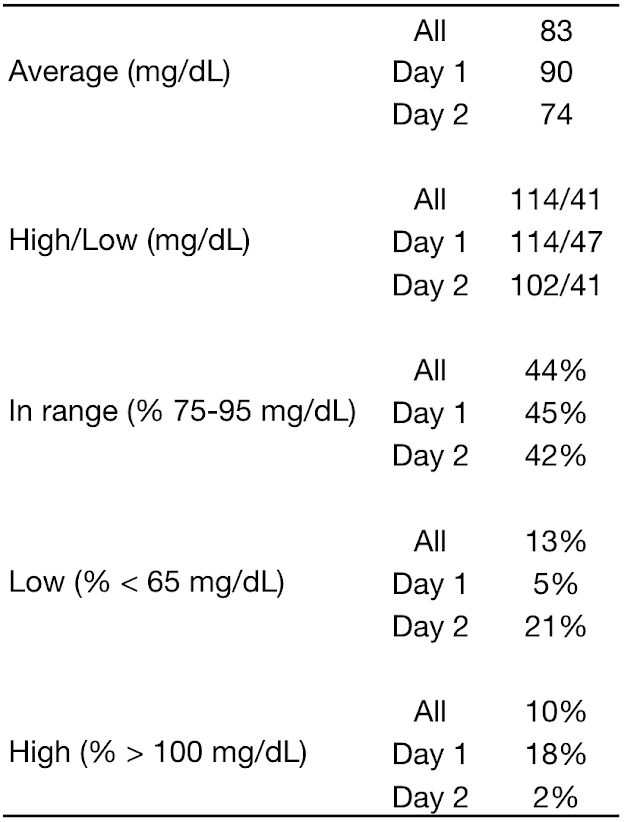
Overall. The full set of data is shown in Figure 1 with summary statistics in Table 1. Major insights:
- I had far more hypoglycemic events than I expected, 13% overall and 21% in day 2, with a low of 41 mg/dL. This was extremely disturbing, as hypoglycemia can be extremely dangerous. A closer look at the data (see Evening section), shows this to be from riding a stationary bike, which I hadn’t noticed before because my sugar returns to normal levels after 30-45 min.
- Other than the low episodes in the evening, and factoring out time spent high due to eating extra glucose as an experiment, my control was pretty good.
- Clear dips and spikes were visible from eating, exercise, and insulin, many of which occurred at shorter time scales than I normally test.
To really see what’s going on, though, let’s zoom in different times of the day.
Morning:
- Waking to breakfast:
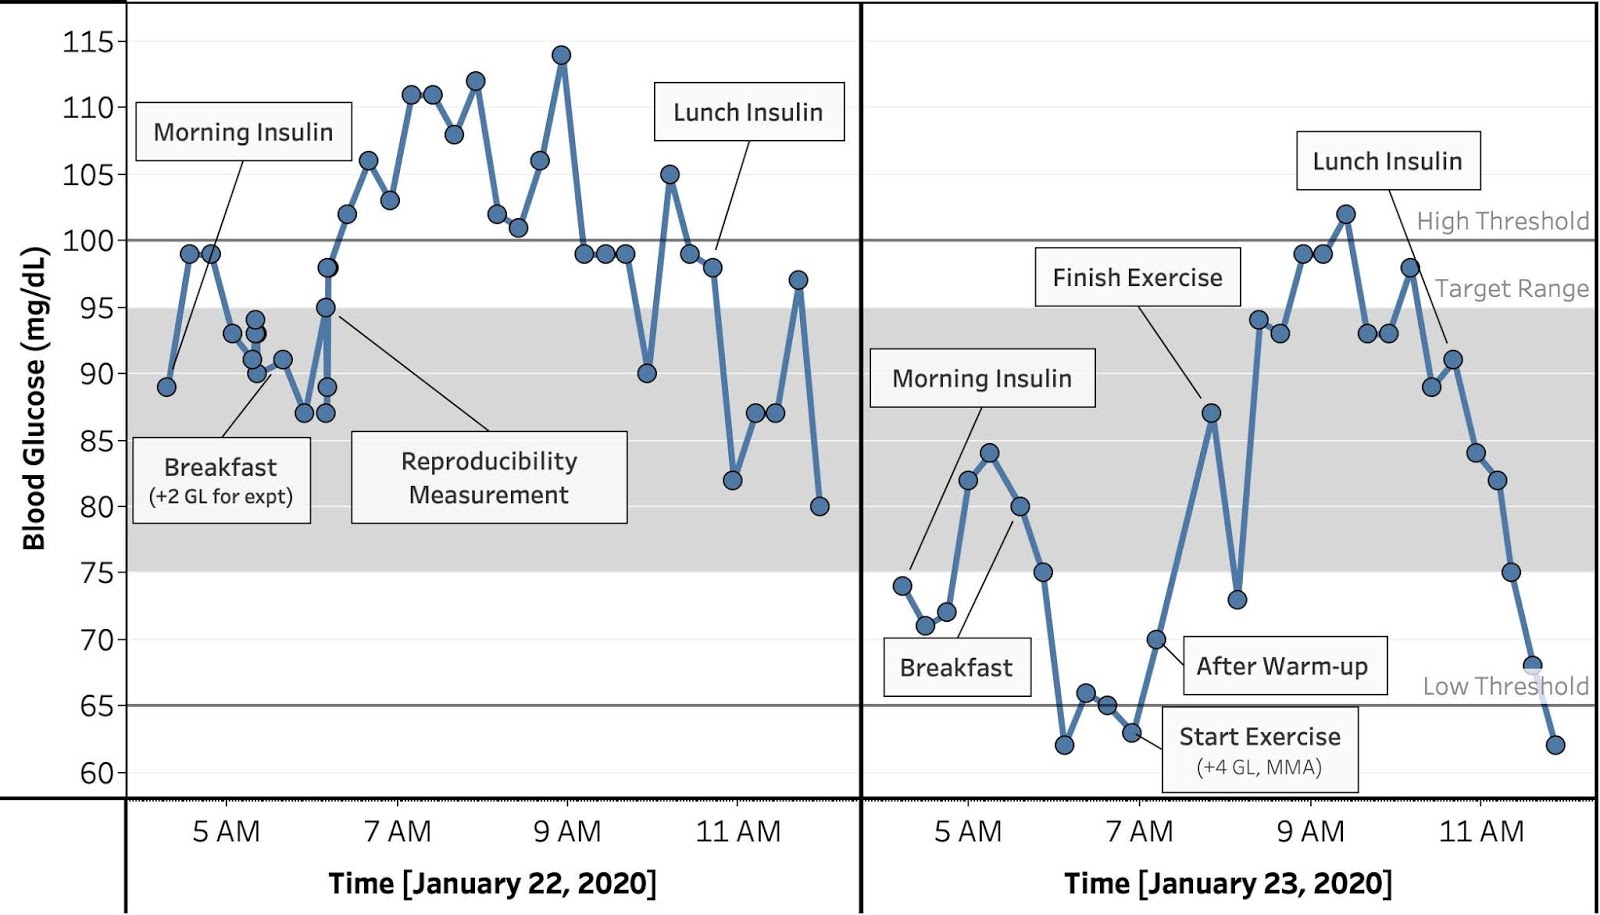
- The first morning, there was a 10 mg/dL rise, followed by an identical drop over the next 45 min. My normal routine of measuring up arising and before dosing for meals would completely miss this.
- The second morning, the rise was the same magnitude (10 mg/dL), but slower, so there was time for it to fall back down before my breakfast insulin. Either way, looks like there’s some timing variability here. Need to investigate further.
- Breakfast:
- The first morning, I ate an extra 2 g glucose as part of my food & exercise experiments (see next experiments) and saw an immediate rise in sugar, reaching peak after about 1.5h. Very interestingly, the peak persisted for >5h, much longer than I usually test for.
- The second morning, I saw an 18 mg/dL drop in the first 45 min. after taking insulin, which then stayed steady for the next hour. This is larger than expected given the only difference from Day 1 was not eating the 2 g glucose, but may be within natural variation.
- More significant was the effect of a one hour mixed-martial arts (MMA) class. Since my blood sugar was low, I took 4 g glucose (expected to raise my blood sugar by ~20 mg/dL). From the start to end of exercise, I saw an ~25 mg/dL rise. While this could be accounted for by the 4 g glucose, based on Day 1, I would also expect an ~20 mg/dL rise from breakfast. All together, this suggests a possible 20 mg/dL drop from the MMA class (very speculative, needs more study). On top of that, I saw a brief 15 mg/dL drop after the MMA class finished, which then came right back up. Not sure what this means, but it’s consistent with other exercise effects (see evening section)
- Lastly, the breakfast on Day 2 showed the same long duration peak as day 1, with blood glucose peaking 3.6h after breakfast and persisting for 5 h, until I took my insulin for lunch. I use a rapid acting insulin at breakfast. However, since I made the switch to the rapid-acting insulin, I added additional protein and fiber to the meal. Need to investigate whether I should switch to normal-acting insulin.
Afternoon:
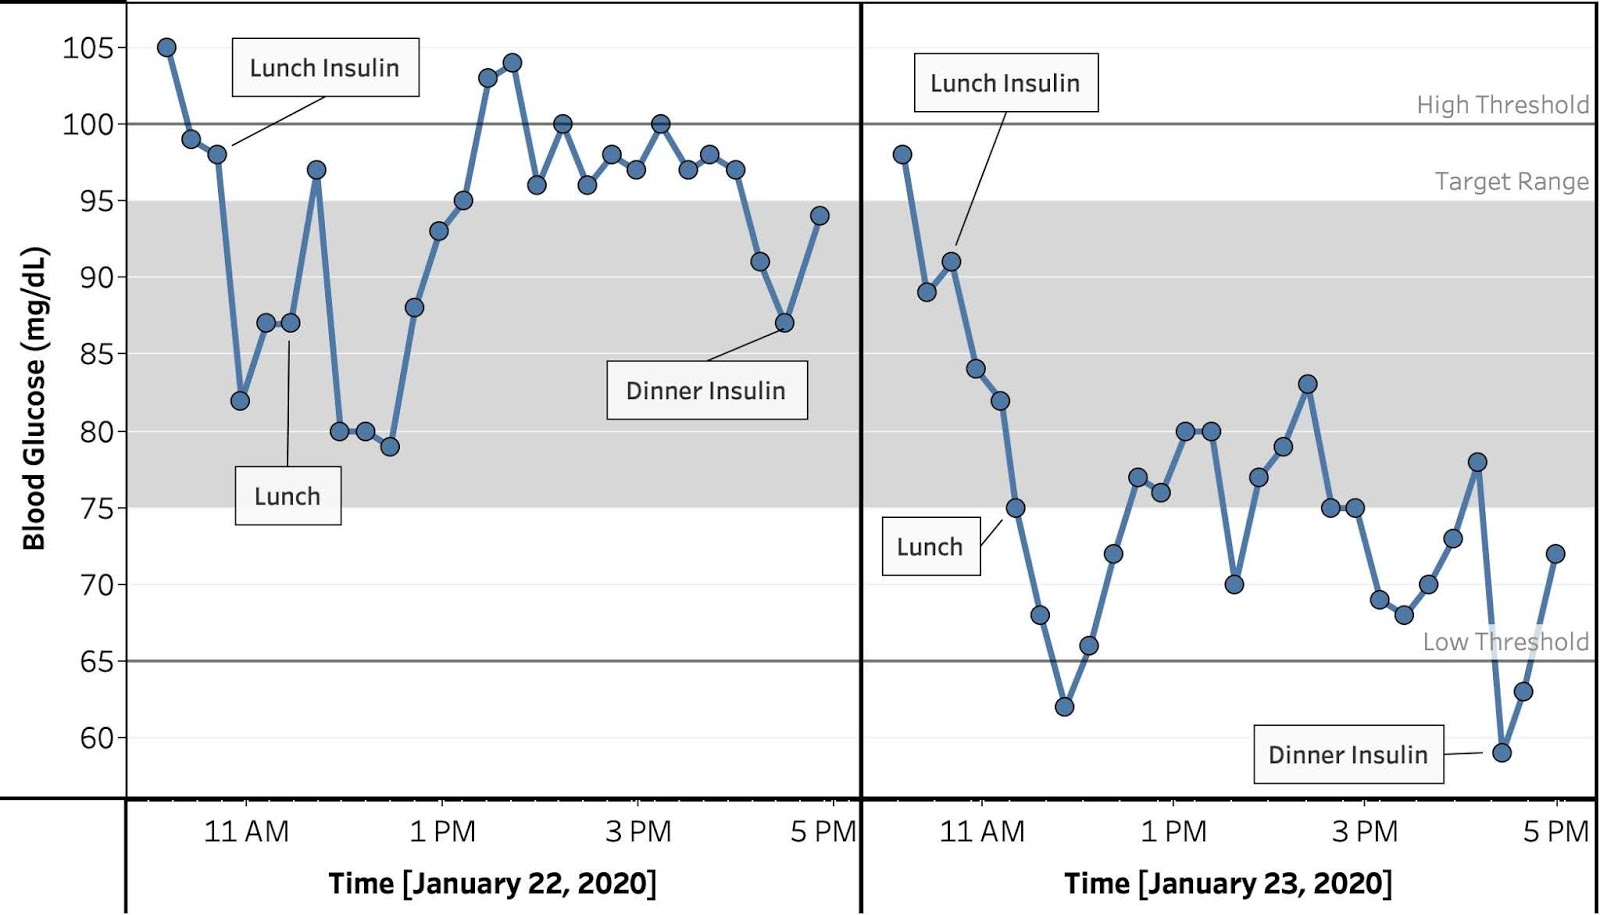
- The afternoon was a lot less eventful. On both days, I saw a 10-15 mg/dL drop in the 40 min. between taking insulin and eating lunch, followed by a continued drop over the next 30 min., then a, ~15 mg/dL rise. On Day 1, the rise almost exactly offset the drop, while on Day 2, the drop was ~10-15 mg/dL larger and therefore wasn’t full offset. This may be due to the morning exercise on Day 2, or some other source of variation. Need to keep an eye on this.
- Either way, lunch medication plus food seems pretty well calibrated, which is a bit odd since my breakfast and lunch are identical. Hypotheses to test:
- There’s some other factor causing a drop in the afternoon, offsetting the long peak seen in the morning
- The long peak at breakfast is related to the dawn phenomenon (additional glucose from liver and/or reduced insulin sensitivity)
- To test these, could try skipping meals and their associated insulin, which should have different effects depending on the cause of the discrepancy.
Evening:
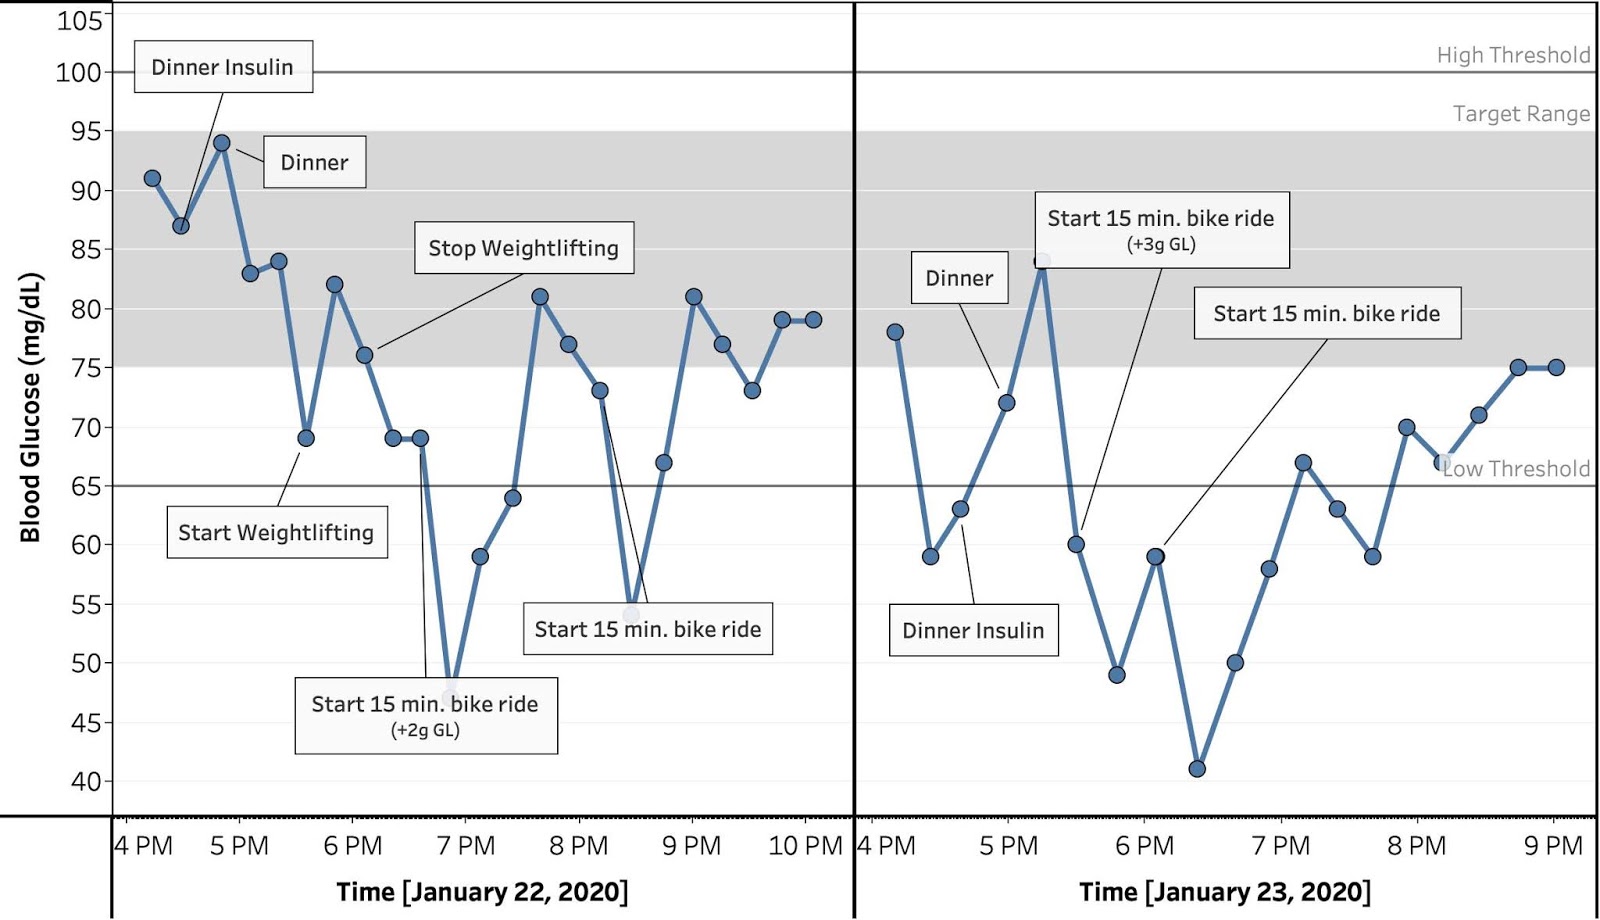
- The fact that I both eat dinner and exercise in the evening makes analysis difficult. Need to run experiments where I do one or the other to better disentangle the effects.
- Dinner:
- On both days, my blood glucose increase slightly after taking my dinner insulin. This suggests my blood sugar may still have been rising from after lunch, however, this is a very long time for food to be having an effect. Since my breakfast and lunch are high in protein and fiber, I tried to find information on their direct and indirect effects on blood sugar. However, the information I found was both spotty and ambiguous (especially for fiber, for which I found a lot of articles on using it for diabetes prevention, but no well controlled studies of its immediate effect on blood sugar). Need to test this directly.
- After the immediate drop, exercise prevents any meaningful analysis of the effect of dinner except to say it doesn’t appear to significantly raise my blood sugar.
- Exercise:
- I did ~30 min. of weightlifting on Day 1. During that time, I saw a ~12 mg/dL spike, which came back down immediately after. My blood sugar typically increases at the start of exerciseand this is consistent and small enough not to worry about.
- The effect of biking was more significant. I typically to 2×15 min. stints on a stationary bike in the evenings and previously hadn’t noticed any major effects on my blood sugar at my normal 1h and 2h post-meal checks. By testing every 15 min., I can see that, even with taking glucose before starting, these bike rides are dropping my blood sugar by 10-20 mg/dL over the course of the ride, after which it comes back up to baseline over 30-45 min.
- On both days, even with taking glucose before hand, the bike rides sent me into dangerously hypoglycemic territory. Notably, I didn’t notice any symptoms of hypoglycemia, possibly because they were overshadowed by the effect of the exercise itself.
- This drop during biking is very worrisome and something I completely missed with my normal testing routine. A few takeaways:
- I need to run more experiments to figure out the exact details and how to mitigate this effect. Bike further away in time from peak insulin
- Use a faster acting and/or better timed glucose to offset drop
- Since blood sugar can drop then rise quickly with physical activity, I can’t rely on just testing before and after meals. For any physically significant activity, I need to test before and after until I’m sure I understand it’s effect.
Overnight. I saw a 5 mg/dL drop overnight between Day 1 and Day 2. That’s within the normal variance of my meter, so I’ll check over a larger number of days to see if it’s real. Either way, not significant relative to the other effects I observed.
Conclusions & Next Experiments
See summary section above
– QD
testing comment system