This is an update on my experiments to determine the cause and methods to reduce my elevated blood pressure. In this post, I take a look at the correlations between blood pressure and my other self-tracking metrics.
I didn’t find any large or actionable effects, but I’m concerned that the statistical analysis I did was too simplistic or otherwise not correct.
If anyone is interested in taking a look at the data, let me know. All the raw data is provided below, but I’m happy to do additional data processing/cleaning if it would be helpful.
Summary
- Background:
- I’ve been measuring blood pressure, sleep, weight, hemoglobin, and cholesterol for the past 6 months.
- This provides a (hopefully) rich dataset for identifying environmental or lifestyle factors that influence my blood pressure.
- Notably, I observed that my blood pressure seems elevated on days after after I’ve had low blood sugar the night before, indicating a possible effect (no statistical or other rigorous analysis done)
- Approach:
- 6 months of self tracking data was aggregated and cleaned.
- Pearson R and p-value were calculated for 26 metrics that seemed most likely to influence blood pressure compared with systolic pressure, diastolic pressure, and pulse.
- Results & Conclusions:
- No metric had a large & statistically significant correlation with either systolic or diastolic
- Sleep had the largest correlation with systolic pressure:
- Effect Size: -1.1 mmHg/h asleep
- R2 = 0.05
- p-value = 0.03
- There was a statistically significant correlation between cholesterol and both systolic & diastolic pressure, but it was in an implausible direction (higher cholesterol showed lower blood pressure), so is likely due to a common cause.
- Pulse showed a strong correlation with fasting blood glucose. My suspicion is that this is related to the dawn phenomenon (liver dumping glucose into the blood in the morning to provide energy) as the time from waking up to doing my BP measurements may be correlated to both measures.
- Effect Size: 0.08 bpm/(mg/dL glucose)
- R2 = 0.14
- p-value = 0.0005
- Pulse also showed a strong correlation with body weight, though this is likely due to increased aerobic exercise during the same time period.
- Next Steps:
- Given the small effect sizes and lack of statistical significance, unless I screwed up the analysis, I don’t see any reason to follow up on these results.
- Instead, I’ll take a look after 3-6 months and see if additional data surfaces anything useful.
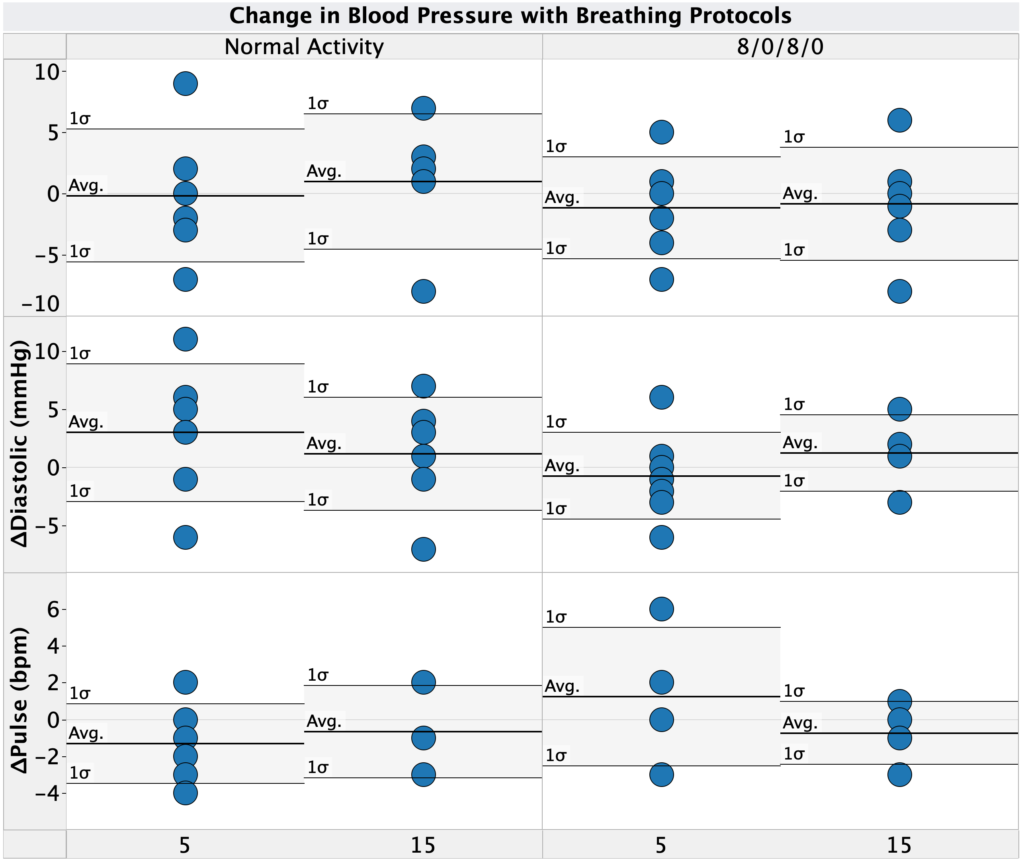
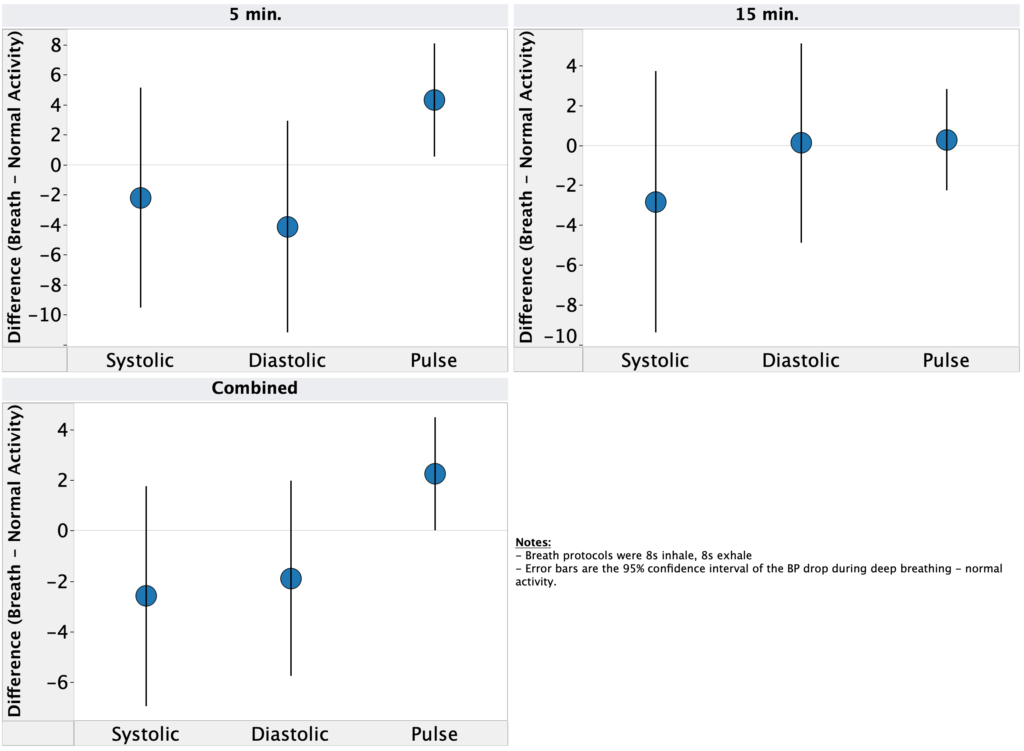
- Inspiratory muscle training:
- u/OrganicTransistor suggested trying strengthening my respiratory muscles based on the results in this paper.
- The results look promising, so I’m going to give the protocol in the paper a try.
- This study will take six weeks. I’ve currently completed 8 days and will do an interim analysis every two weeks.
- Decrease Sodium/Potassium ratio
- Sodium/Potassium ratio has been shown to strongly correlate with blood pressure and incidence of heart disease.
- Many years ago, my dad has high blood pressure that lowered significantly when he reduced his sodium intake.
- I’m going test substituting a large fraction of my added sodium intake with potassium. Experimental details and pre-registration to follow in a separate post.
Details
Purpose
- To determine if any of the metrics I track correlate with blood pressure.
Background
For additional background, see previous post.
- I’ve been measuring blood pressure, sleep, weight, hemoglobin, and cholesterol for the past 6 months.
- This provides a (hopefully) rich dataset for identifying environmental or lifestyle factors that influence my blood pressure.
- Notably, I observed that my blood pressure seems elevated on days after after I’ve had low blood sugar the night before, indicating a possible effect (no statistical or other rigorous analysis done)
Results & Discussion
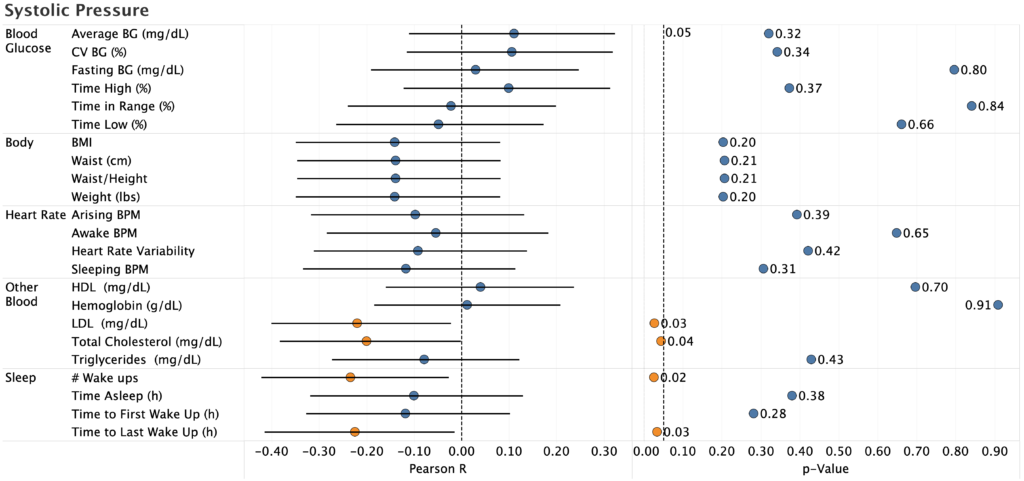
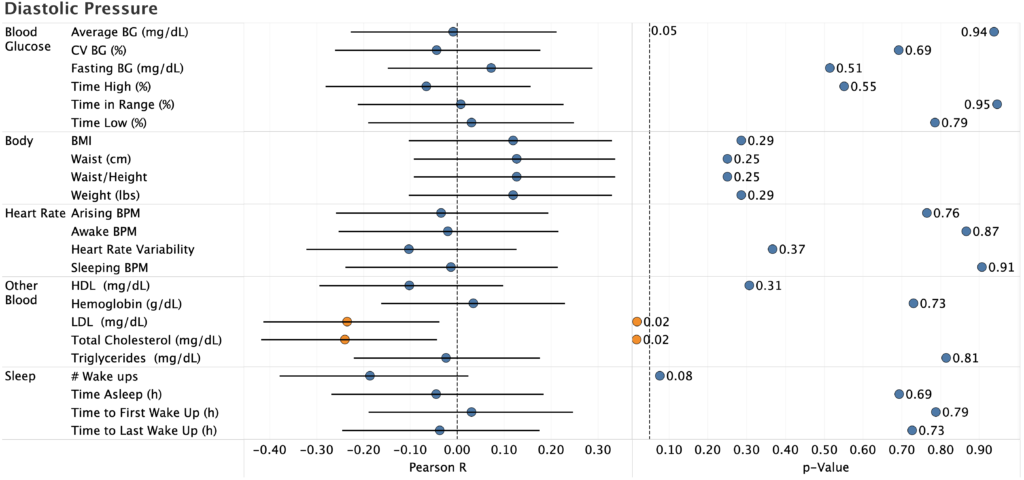
Systolic & Diastolic Pressure
- The only statistically significant effects were:
- Total cholesterol (systolic and diastolic)
- LDL (systolic and diastolic)
- # Wake ups (systolic only)
- Time to Last Wake Up (manual recording of time asleep, systolic only)
- Pearson R is negative for the two cholesterol correlations, which is biologically implausible (there’s no reason high cholesterol would reduce blood pressure). Since I only measure cholesterol once every two weeks, there’s not much data there, so it’s likely a spurious correlation.
- For sleep, the correlation is likely real (p=0.03, 95%CI does not overlap zero), but the effect size is to small to be useful:
- R2 = 0.05
- -1.1 mmHg/h of sleep (i.e. I’d need to sleep an additional 5h to reduce BP by 5 mmHg, which is impossible even if the effect stayed linear)
- This gives further evidence to the desirability of keeping my sleep under control, but does not provide a way to meaningfully reduce my blood pressure (I already sleep 6-6.5h/night, so there’s not enough room for improvement).
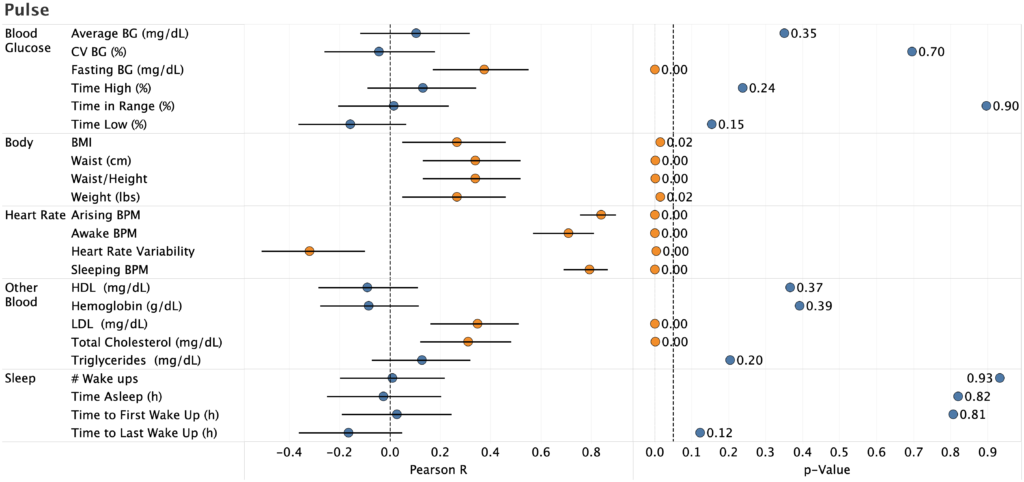
Pulse
- Unsurprisingly, pulse strongly correlated with pulse and heart rate variability measured by my Apple Watch. Nice to see, but not actionable.
- Strong correlation with fasting blood glucose with a large effect size.
- Effect Size: 0.08 bpm/(mg/dL glucose)
- R2 = 0.14
- p-value = 0.0005
- My suspicion is that this is related to the dawn phenomenon (liver dumping glucose into the blood in the morning to provide energy) as the time from waking up to doing my BP measurements may be correlated to both measures. I already work to keep my fasting BG in the normal range for a non-diabetic, so there’s nothing actionable here.
- There’s also a strong correlation between pulse and body weight, though this is likely due to increased aerobic exercise during the same time period.
Conclusions & Next Experiments
Based on the analysis above, none of the observed correlations meet my target for practical significance (ability to reduce BP by 5 mmHg under practical conditions) and p-value thresholds.
I’m concerned, however, that the statistical analysis I did was too simplistic or otherwise not correct. In particular:
- Would a mixed-effect model or other more sophisticated technique surface effects that I can’t detect?
- Are there interaction effects that, if accounted for, would provide better predictive value?
- Are there other metrics that I missed (e.g. different time lags)?
If anyone is interested in taking a look at the data, let me know. All the raw data is provided below, but I’m happy to do additional data processing/cleaning if it would be helpful.
Absent someone finding an effect I missed, I don’t see any reason to follow up on these results. Instead, I’ll take a look after 3-6 months and see if additional data surfaces anything useful.
In the meantime, I’ll focus on testing additional interventions. Specifically:
- Inspiratory muscle training:
- u/OrganicTransistor suggested trying strengthening my respiratory muscles based on the results in this paper.
- The results look promising, so I’m going to give the protocol in the paper a try.
- This study will take six weeks. I’ve currently completed 8 days and will do an interim analysis every two weeks.
- Decrease Sodium/Potassium ratio
- Sodium/Potassium ratio has been shown to strongly correlate with blood pressure and incidence of heart disease.
- Many years ago, my dad has high blood pressure that lowered significantly when he reduced his sodium intake.
- I’m going test substituting a large fraction of my added sodium intake with potassium. Experimental details and pre-registration to follow in a separate post.
– QD
Methods
Pre-registration
Here.
Differences from original pre-registration:
- Did not analyze correlations with exercise
- Reason: insufficient data
- Instead of a mixed-effect model, I just calculated Pearson R and p-value for each correlation.
- Reason: Since there were no effects of a practical/ actionable magnitude, I didn’t spend the effort to figure out how to implement the mixed effect model.
Blinding
This experiment was not blinded
Procedure
Data Visualization
Data was visualized using Tableau.