Get new posts by email or rss feed
Acknowledgements: Thanks /u/genetastic for advice on the statistical analysis!
This post is an update on my experiments to quantify the effect of vinegar on blood glucose & to better understand the underlying mechanism by determining how this effect varies with person/metabolic status, dose, source of calories, and type of acid.
Previous posts in this series:
- Phase 0: Literature survey & Pre-registration
- Phase 1: Literature replication
Phase 2 – Testing Diluted Vinegar
Summary
In Phase 1, /u/genetastic, /u/kabong, and I replicated the literature showing that vinegar can reduce the blood sugar impact of complex carbohydrates (white bread). From those experiments, we found that:
- Vinegar significantly lowered blood glucose
- Peak change in blood glucose & iAuC were reduced by 20% and time to peak blood glucose & initial rise were slowed by 15-20 min. (30-50%).
- P-values were all <0.05, with the exception of the drop in iAuC, which was 0.12
- The concentration of vinegar we used was extremely unpleasant to consume. So much so that I, at least, wouldn’t be willing to use it for additional experiments, much less daily life.
In this Phase, I tested a more palatable protocol, vinegar diluted in water (~30g vinegar in ~325g water) drank immediately before the meal. Here’s a summary of the results & next steps (full details below):
- Diluted vinegar had a statistically significant and meaningful impact on blood glucose compared with no vinagar:
- Peak change in blood glucose and iAuC were reduced by ~20% and time to peak was slowed by ~20 min.
- P-value was <0.05 for the change in peak blood glucose, but not for iAuC and time to peak.
- Diluted vinegar gave very similar results to undiluted, with virtually no change in peak blood glucose and only a modest increase in iAuC and decrease in time to peak. None of these differences were statistically significant.
- These results give further evidence that the effect of vinegar on blood glucose is real and provide a practical protocol that can be used for further experiments. For the next phase, I will be testing the following:
- Alternate macronutrients (simple sugars, proteins) to determine scope of the effect
- Alternate acid sources to test the amylase-inhibition hypothesis
- Whether this effect is significant with full meals, including insulin doses
- For this last experiment, I will randomly drink 30g ACV in 325g water before my standard breakfast (50g ketochow, 2 tbsp butter, water to 12 oz total volume) and monitor BG impact.
It would significantly improve the study to have a larger number of participants. If you’re interested in collaborating on this or other scientifically rigorous self-experiments with low-carb foods, supplements, or other health interventions, please let me know in the comments or via the contact form on the right.
– QD
Details
In Phase 1, /u/genetastic, /u/kabong, and I replicated the literature showing that vinegar can reduce the blood sugar impact of complex carbohydrates (white bread). From those experiments, we found the following:
- We observed a similar effect of vinegar on blood glucose as that reported in the literature.
- The effect was observed for both experimenters with diabetes (/u/sskaye, /u/kabong) and normal metabolism (/u/genetastic)
- The effect was both statistically significant and meaningful in magnitude, justifying further study of the scope, mechanism, and optimal protocol.
- Peak change in blood glucose & iAuC were reduced by 20% and time to peak blood glucose & initial rise were slowed by 15-20 min. (30-50%).
- P-values were all <0.05, with the exception of the drop in iAuC, which was 0.12
This was a great start to the study, with one big problem. The concentration of vinegar we were using (undiluted for /u/kabong and I, 30g vinegar in 80g water for /u/genetastic) was extremely unpleasant to consume. So much so that I, at least, wouldn’t be willing to use it for additional experiments, much less in daily life.
Given that, if we were going to continue this experiment, we needed see if there was a way to consume the vinegar that was more palatable, but had a similar impact on blood glucose. The simplest option was to dilute the vinegar in water. Personally, I find diluted fruit vinegar to be enjoyable to drink and do so regularly (review and recipe).
To test the blood glucose impact of diluted vinegar, I repeated the original literature replication with ~30g vinegar diluted in ~325g water (the most concentrated amount I still found pleasant to drink). I also ran one additional control experiment (no vinegar). Peak change in blood glucose, time to peak change in blood glucose, and integrated area under the curve (iAuC) were calculated. An independent, two-sample Student’s t-test was used to calculated p-values between each condition. Results from these tests, along with the original replication are shown in the Figure and Table below.
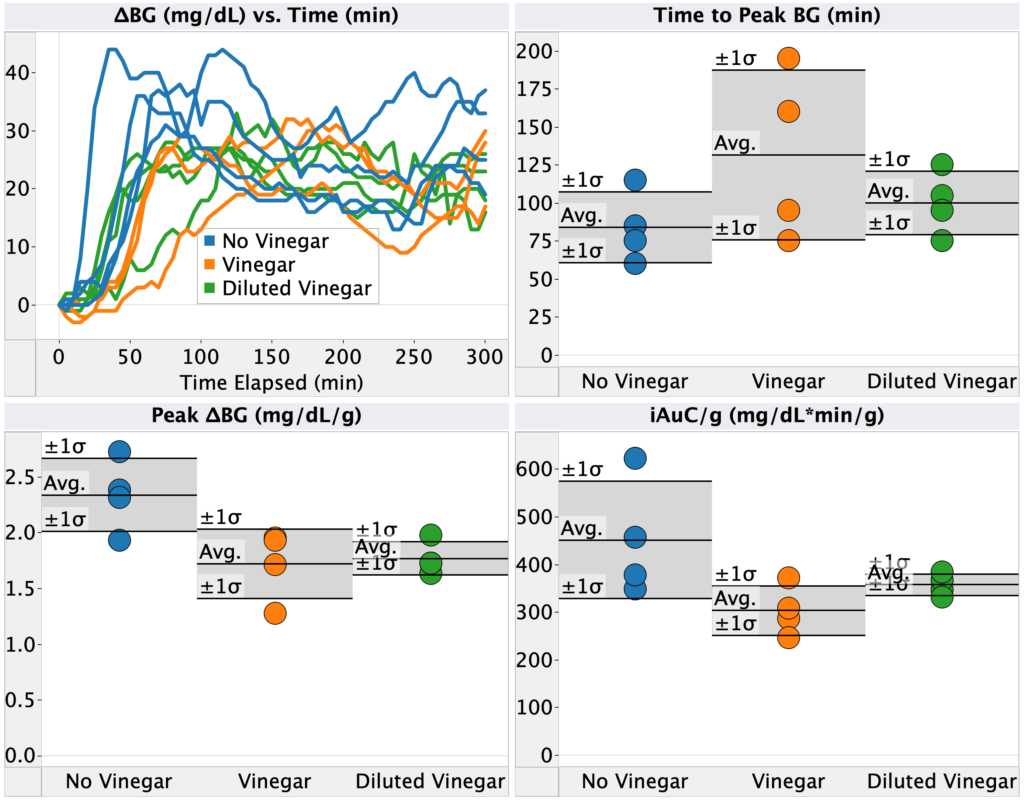
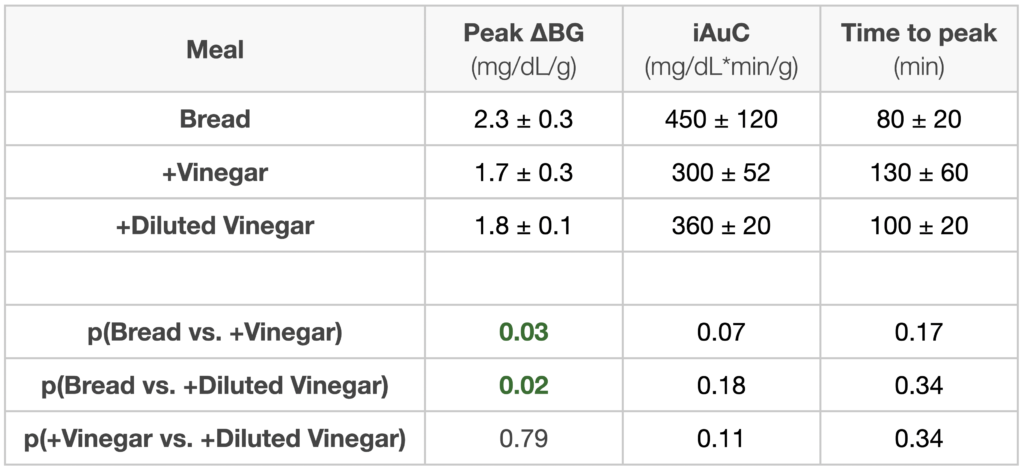
Compared with no vinegar, the blood glucose impact from diluted vinegar were statistically significant and meaningful in magnitude. Peak change in blood glucose and iAuC were reduced by ~20% and time to peak was slowed by ~20 min. P-value was <0.05 for the change in peak blood glucose, but not for iAuC and time to peak.
Most importantly, diluted vinegar gave very similar results to undiluted, with virtually no change in peak blood glucose and only a modest increase in iAuC and decrease in time to peak. None of these differences were statistically significant.
These results give further evidence that the effect of vinegar on blood glucose is real and provide a practical protocol that can be used for further experiments. For the next phase, I will be testing the following:
- Alternate macronutrients (simple sugars, proteins) to determine scope of the effect
- Alternate acid sources to test the amylase-inhibition hypothesis
- Whether this effect is significant with full meals, including insulin doses
- For this last experiment, I will randomly drink 30g ACV in 325g water before my standard breakfast (50g ketochow, 2 tbsp butter, water to 12 oz total volume) and monitor BG impact.
It would significantly improve the study to have a larger number of participants. If you’re interested in collaborating on this or other scientifically rigorous self-experiments with low-carb foods, supplements, or other health interventions, please let me know in the comments or via the contact form on the right.
– QD
Methods
The original experimental design was pre-registered here. The following changes were made from the original pre-registration:
- For this phase, only QD ran experiments.
- Treatments were not alternated, instead, the new experiments were V+/W(15 days)/V+/W(5 days)/V-/W/V+/V+ (V-: no vinegar; V+: vinegar; W: wash/no experiment).
Materials
- Meal: white bread (starch)
- Vinegar:
- Apple cider vinegar (~30g, amount recorded)
- Either without dilution or diluted in 305-325g water (amount recorded)
Blinding
- Vinegar supplementation was not blinded
- However, the protocol was established in advance and adhered to without modification once experiments started.
Procedure
- Condition 1 (no vinegar): ~16g white bread was eaten soaked in 30g water
- Condition 2 (+vinegar): ~16g white bread was eaten soaked in 30g apple cider vinegar
- Condition 3 (+diluted vinegar): 30g apple cider vinegar was diluted in 305-325g water. The mixture was drank at my normal rate, making sure to coat my entire mouth with the solution. Immediately up finishing, ~16g white bread was eaten.
- For all conditions, blood sugar was monitored for 5h using a Dexcom G6, with calibration performed 15-30 min. before the start of the experiment.
- Treatments were not alternated, instead, the new experiments were V+/W(15 days)/V+/W(5 days)/V-/W/V+/V+ (V-: no vinegar; V+: vinegar; W: wash/no experiment). Results were combined with the data from the previous phase for analysis.
Analysis
- Peak blood glucose, iAuC, and time to peak blood glucose were calculated for each experiment.
- An independent, two-sample Student’s t-test was used to test if the values for any of the above metrics were different between each condition.
Data Processing & Visualization
Data was visualized using Tableau.