Apologies for the missed post this week. I’m helping out a company developing a COVID-19 test and didn’t have time to analyze & post my latest experiments. I’m still collecting data for the food effect study and will analyze and post results as soon as I have time.
I hope everyone is staying as safe and healthy as possible in these crazy times.
This self-experiment is being done as part of the Keating Memorial Self-Research Project. A couple of other people from the Open Humans community are also running the same experiments. If you’re interested in joining in, let me know in the comments or send me a PM.
This post is an update on my experiments measuring the effect of food ingredients on blood sugar.
This week, I have the results from whey protein and olive oil.
Summary
Olive oil had a negligible effect on my blood sugar, ~0.1 mg/dL/g(olive oil) for ~350 kcal of oil, or 1.5% that of glucose.
Whey protein isolate increases my blood sugar by ~20% that of glucose (by iAUC), but with a slower rise. This result sin a lower peak, 0.68 mg/dL/g(whey) or 10% that of glucose, but a long tail of increased blood sugar, ~0.4 mg/dL/g(whey) @ 4.5 h.
Still deciding what to try next, but it will either be corn starch (to have an example from each major macronutrient), resistant starch (fiber with disputed claims to non-digestibility), or combinations of protein, fat, or fiber with sugar.
Details
Purpose
To quantify the effect of ingestion of food ingredients and ingredient combinations on my blood sugar.
Ingredient Background
Whey protein isolate is a complete protein extracted from milk whey. It’s the most popular protein supplement due to its ease of digestion, rapid absorption, and appreciable content of all 9 essential amino acids.
Olive oil is a cooking oil that’s high in unsaturated fats, primarily oleic, linoleic, and palmitic acid. It’s used extensively in cooking.
Design/Methods
Procedure. From 7 pm the day before through 4:30p the day of experiment, no food or calorie-containing drinks were consumed and no exercise was performed. Non-calorie-containing drinks were consumed as desired (water, caffeine-free tea, and decaffeinated coffee). At ~12 pm, the substance to be tested was dissolved or suspended in 475 mL of water and ingested as rapidly as comfortable. BGM measurements were then taken approximately every 15 min. for 2 h or until blood glucose had returned to baseline, whichever was longer. A final BGM measurement was taken 4.5 h after ingestion.
Measurements. Blood glucose was measured using a FreeStyle Libre flash glucose monitor and a FreeStyle Freedom Lite glucose meter with FreeStyle lancets & test strips. No special precautions were taken to clean the lancing site before measurement. To take a sample, the lancing devices was used to pierce the skin at an ~45 deg. angle from the finger. Blood was then squeezed out by running the thumb and pointer finger of the opposite hand from the first knuckle to the lancing site of the finger. Blood was then wicked into a test strip that had been inserted into the meter and the glucose reading was recorded.
Data Processing & Visualization. iAUC was calculated using the trapezoid method (see data spreadsheet for details). Data was visualized using Tableau.
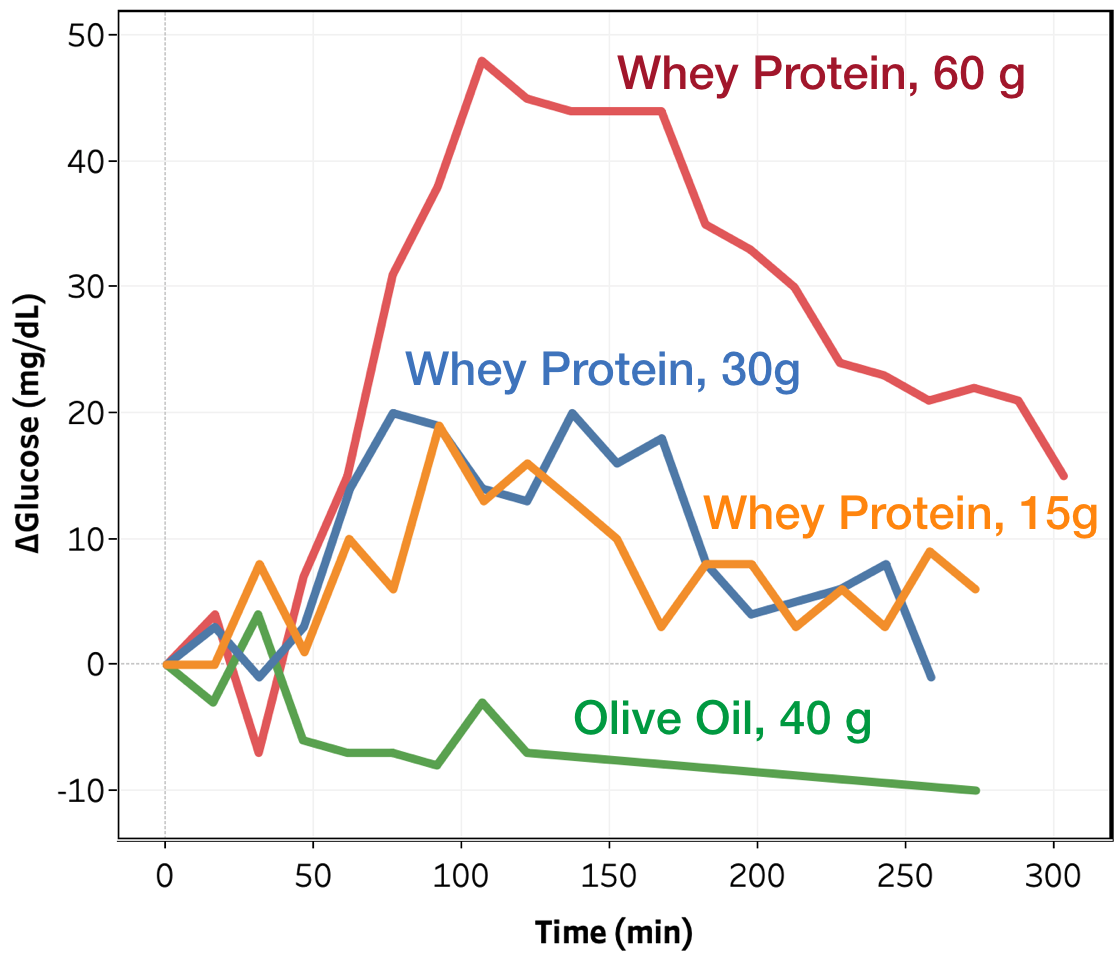
Figure 1. Change in blood glucose vs. time for whey protein and olive oil tests.
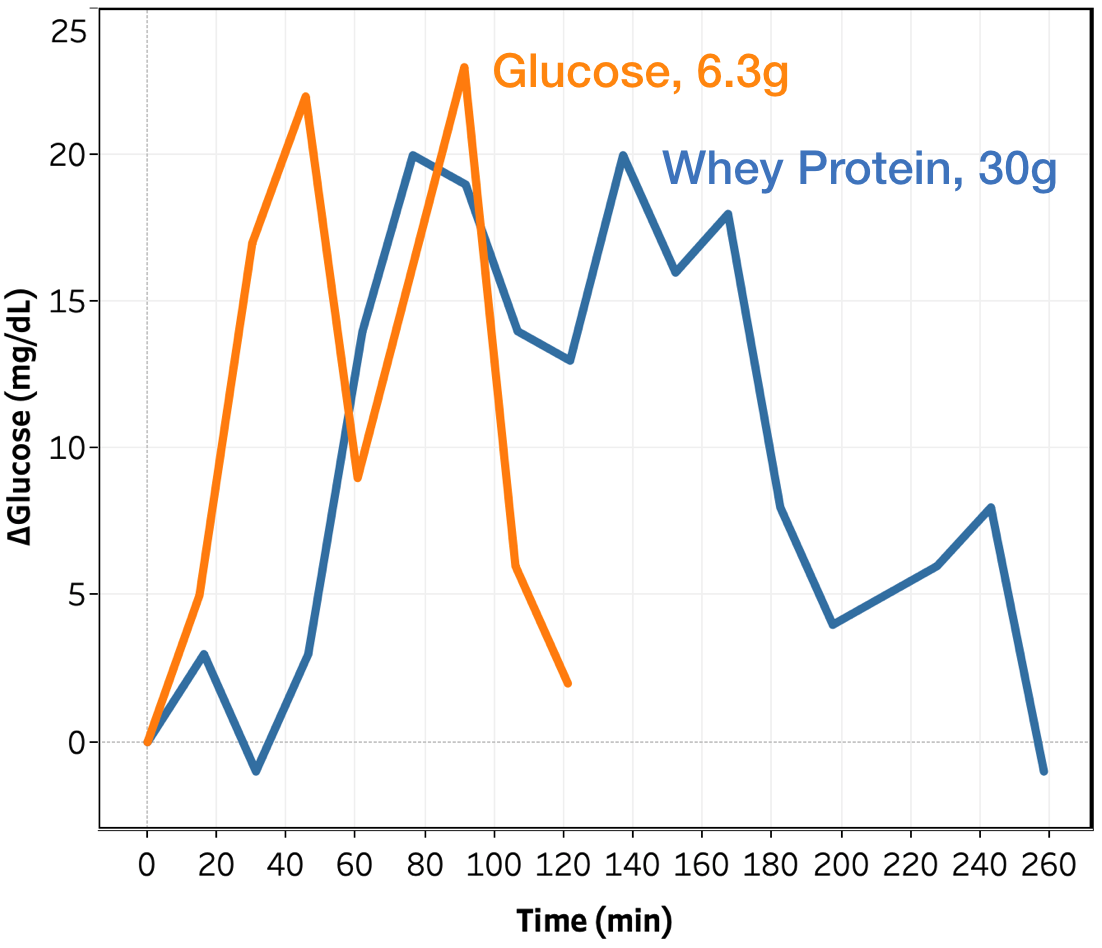
Figure 2. Change in blood glucose vs. time for whey protein and glucose for conditions with a peak of 20-25 Δmg/dL.
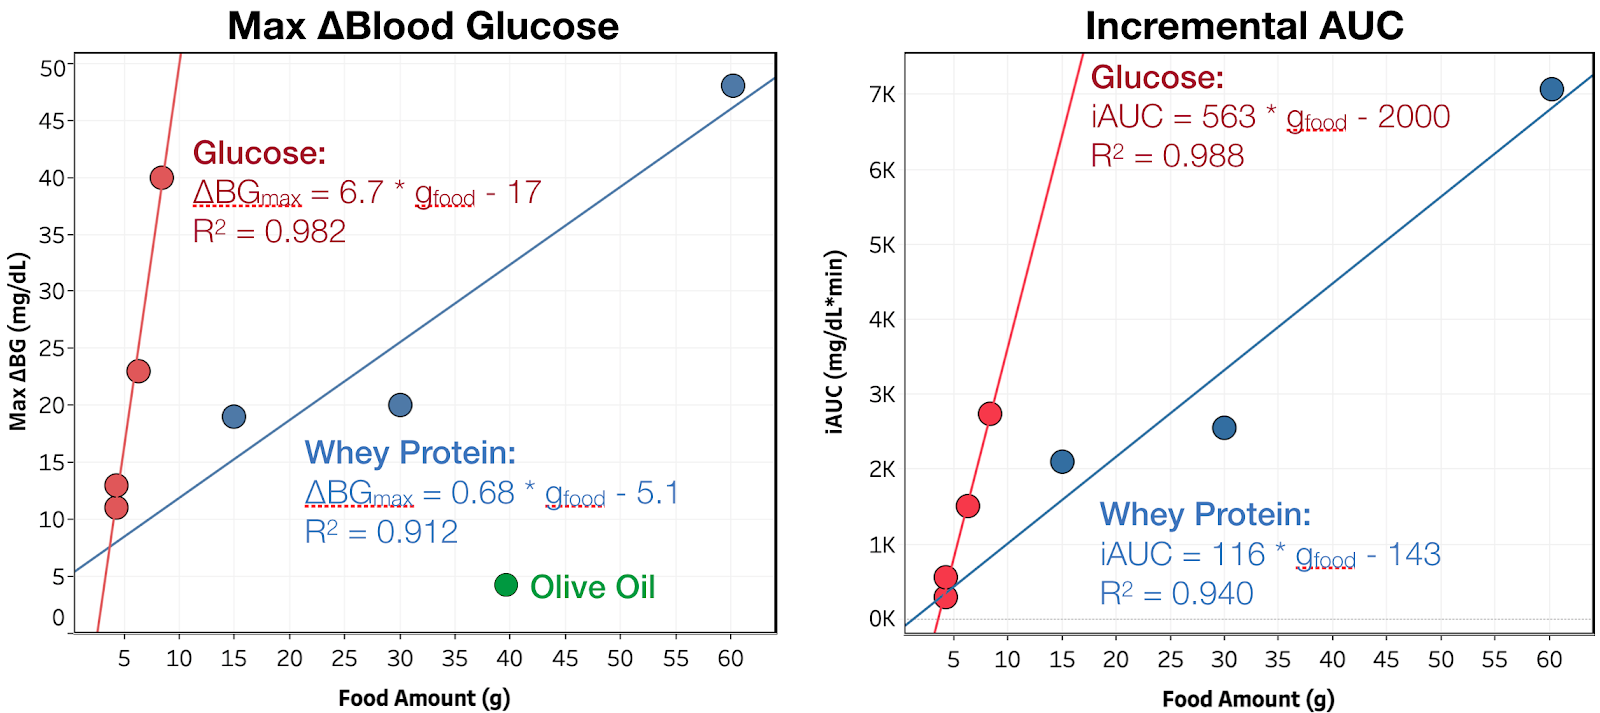
Figure 3. Maximum blood glucose increase and iAUC vs. amount consumed. Red, blue, and green indicate glucose, whey protein isolate, and olive oil, respectively. Lines are the best linear fit to the data.
Changes in blood glucose as a function of time for the whey protein isolate and olive oil tests are shown in Figure 1. As expected, olive oil showed no measurable impact on blood glucose at 40 g, or 350 kCal, consumed. Future experiments will look at whether it or similar oils can modulate the blood sugar response to ingredients that do impact blood sugar.
For whey protein, I observe an increase in blood glucose starting at ~45 min. and reaching a peak between 75-105 min. The magnitude increases with increasing amount consumed, but non-linearly; the difference between the 15 and 30 g consumed conditions is quite small. More data is needed at lower amounts consumed to see if this is a real effect or just noise in the data.
Comparing directly to glucose, for the same peak change in blood glucose, whey protein is much slower to impact my blood glucose and is metabolized over a much longer period of time. For example, looking at the conditions where peak Δmg/dL = 20-25 (see Figure 2):
Time to >5 mg/dL rise is 60 vs. 15 min. for whey vs. glucose
Time to return to <5 Δmg/dL is 255 vs. 120 min. for whey vs. glucose
Results are similar for all other amounts consumed. As show in Figure 3 and the summary table, this slower metabolism results in whey protein having a larger relative impact on iAUC than peak change in blood glucose (20 vs. 10% of glucose per gram). This may be do to giving my body more time to produce endogenous insulin, or even directly stimulating its production, reducing the peak blood glucose. Both of these effects have been reported. Given that, it would be useful to see the same measurements in someone with Type 1 diabetes, who does not produce endogenous insulin.
Conclusion & Next Experiments
Olive oil had a negligible effect on my blood sugar, ~0.1 mg/dL/g(olive oil) for ~350 kcal of oil, or 1.5% that of glucose.
Whey protein isolate increases my blood sugar by ~20% that of glucose (by iAUC), but with a slower rise. This result sin a lower peak, 0.68 mg/dL/g(whey) or 10% that of glucose, but a long tail of increased blood sugar, ~0.4 mg/dL/g(whey) @ 4.5 h.
Still deciding what to try next week, but it will either be corn starch (to have an example from each major macronutrient), resistant starch (fiber with disputed claims to non-digestibility), or combinations of protein, fat, or fiber with sugar.
I’ve been confined to my house for the past couple weeks due to the Bay Area’s “shelter-in-place” order, so I’ve been experimenting with different recipes.
I always liked caramel flavored deserts, so I decided to see if I could get the same effect with allulose.
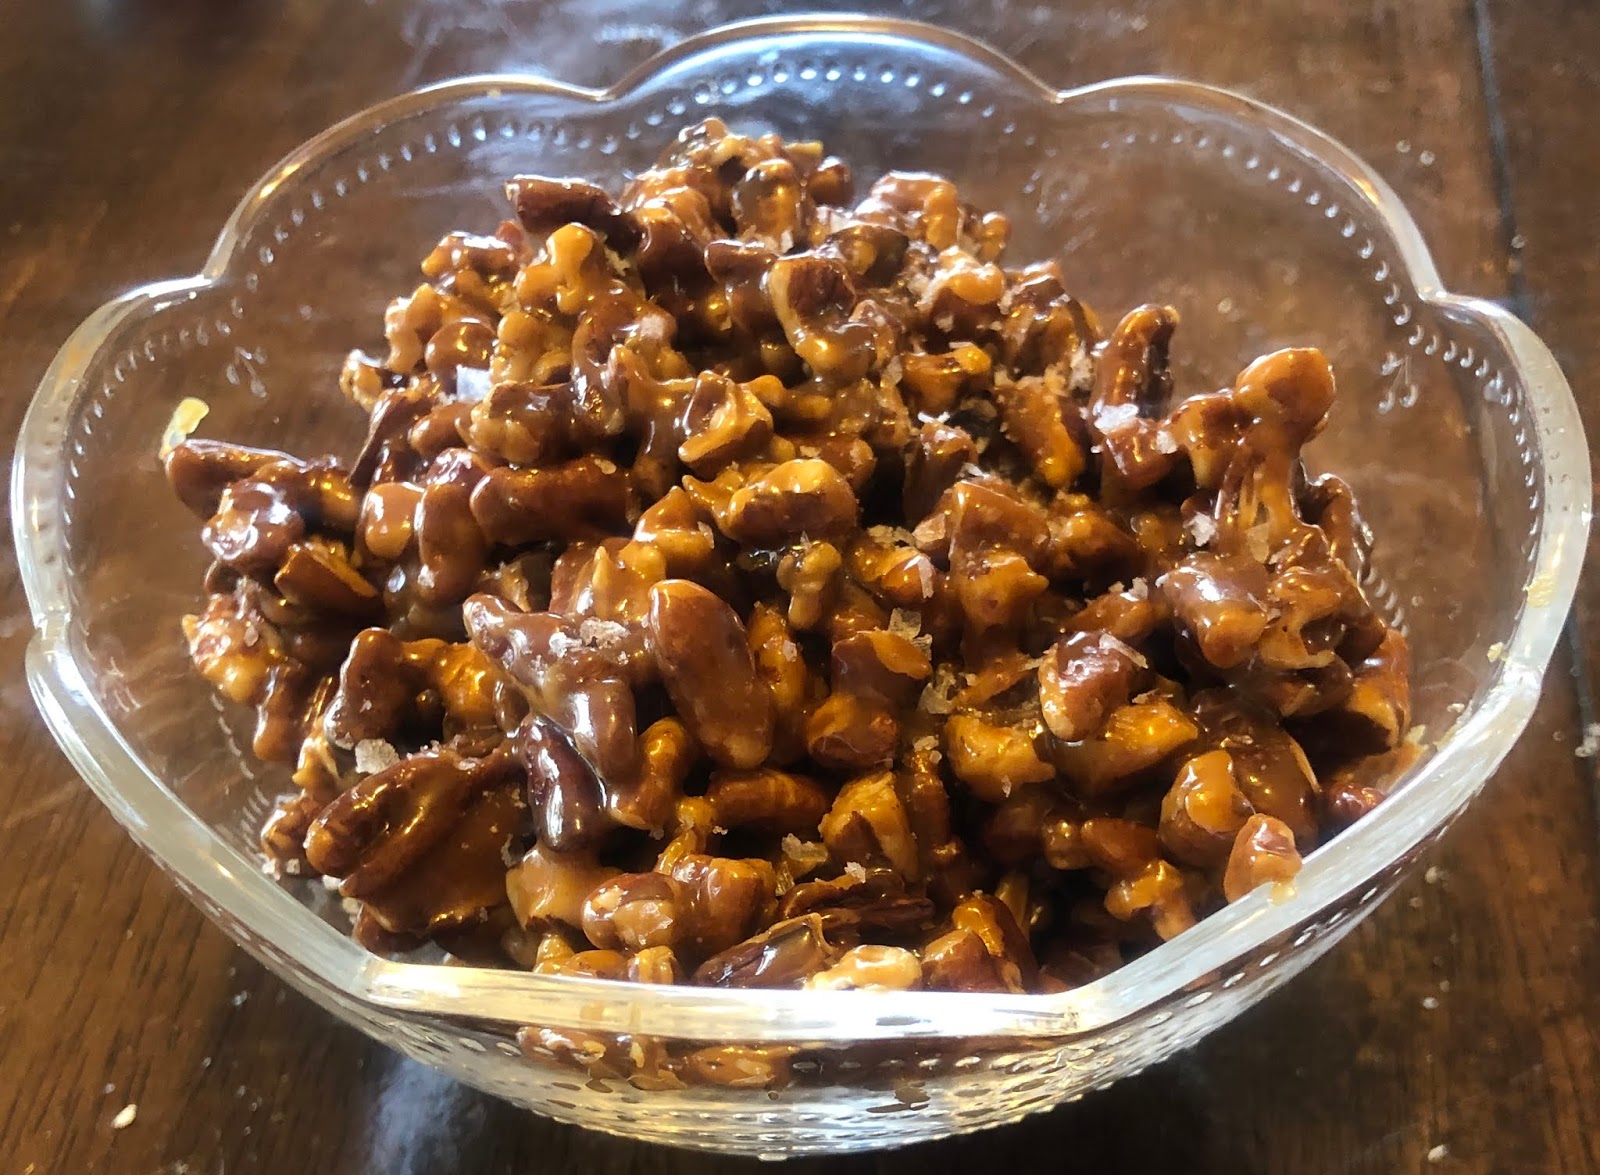
The experiment was successful The allulose browned & caramelized just like sugar. By adding butter and salt, I got a pretty good approximation of salted caramel. I tried it mixed in with toasted walnuts and pecans. The sweet/savory and soft/crunch contrast was fantastic. I personally preferred the walnuts, but you could put it over whatever you’d like.
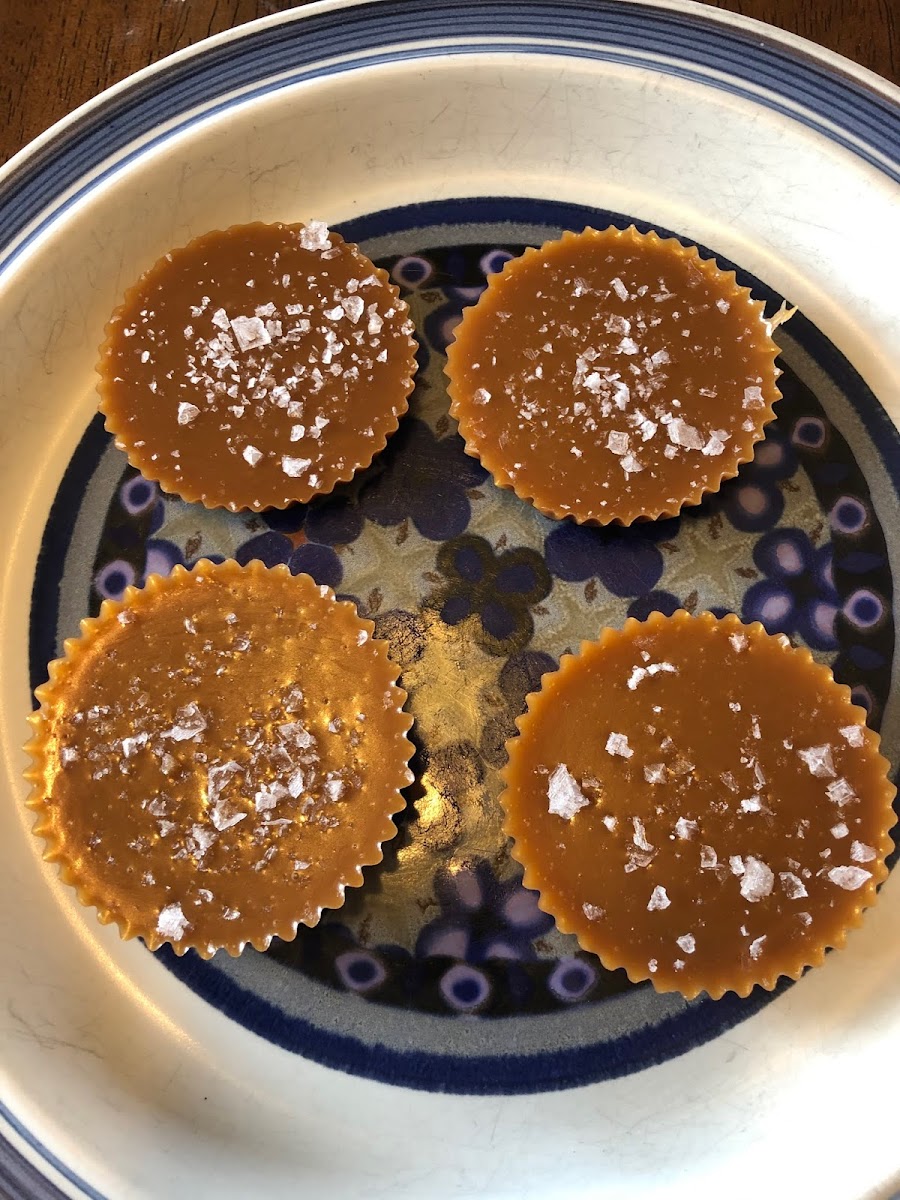
I also tried just pouring the caramel into molds and topping with flaky sea salt. Quite good, but I prefer it over the nuts.
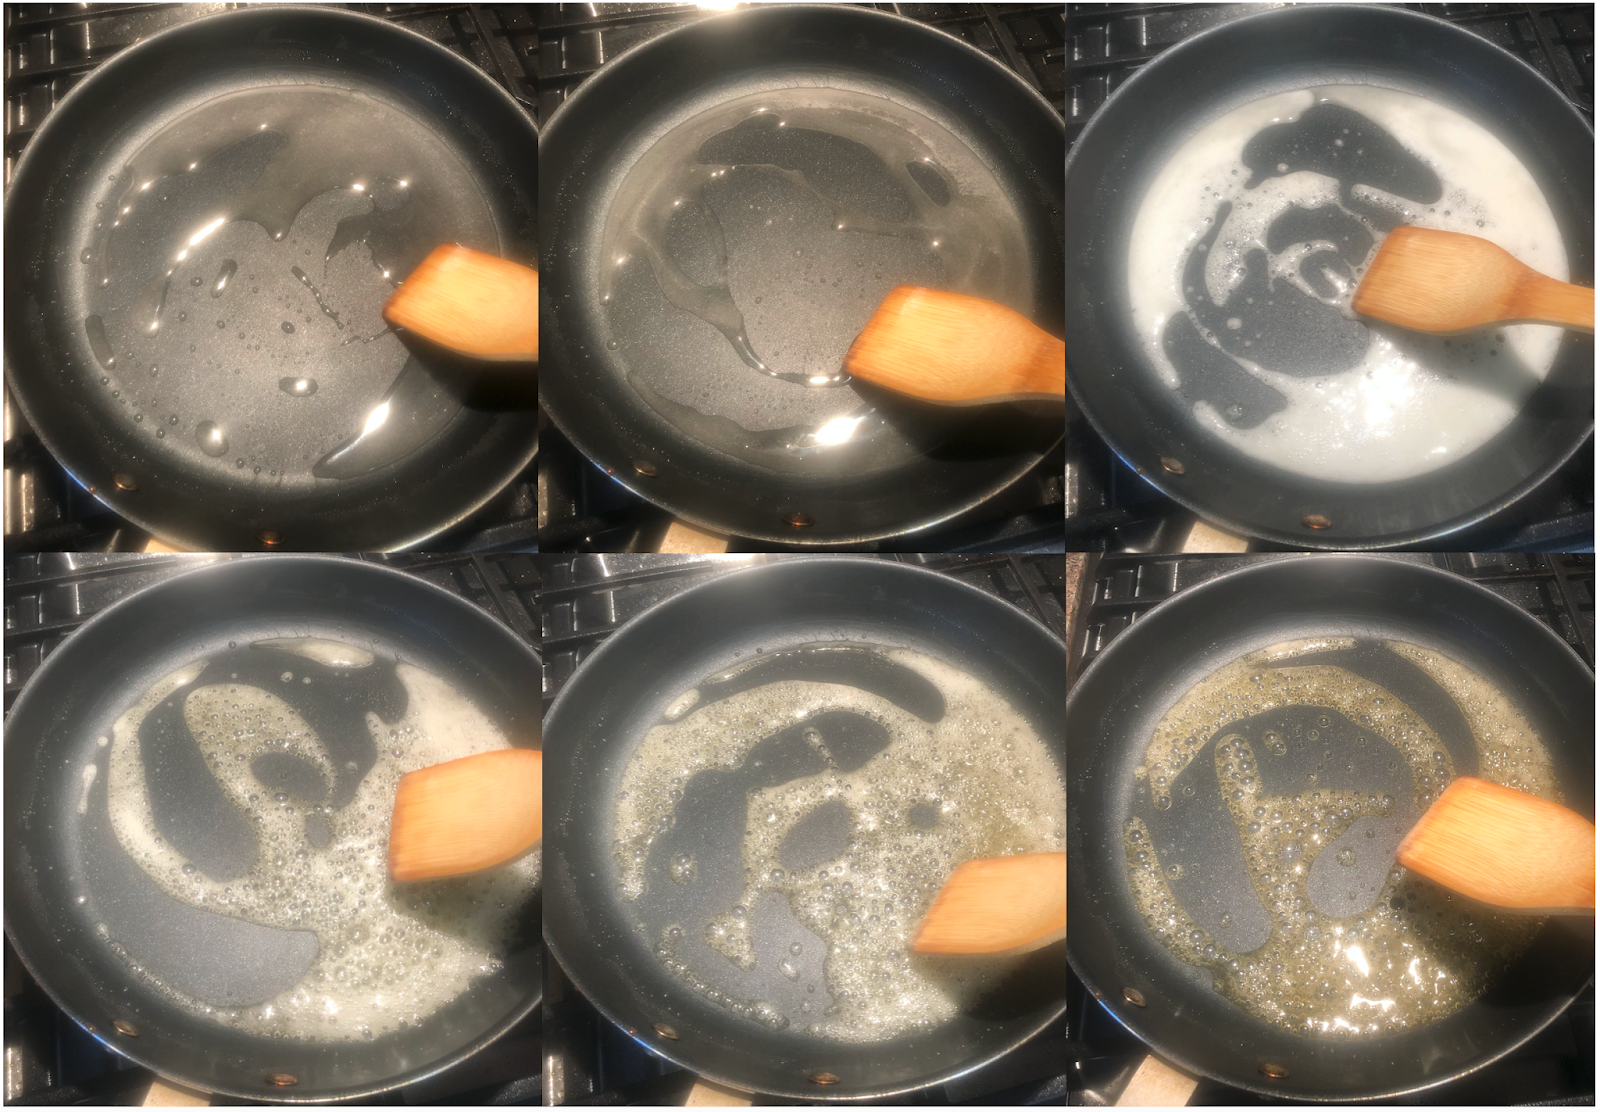
Over medium heat, allulose melted, then caramelized, just like sugar.Plain salted caramel with flaky sea salt
I’ve included the recipe below if you want to try them yourself.
Toast nuts in a skillet over medium heat until fragrant. Set aside.
Add allulose and stir with a wooden spoon or heat resistant spatula. The allulose will clump up, melt, foam, and then brown to form a thick, amber liquid.
Add the butter, stirring continuously until it’s completely melted. Then slowly drizzle in heavy cream. Note: the mixture will bubble vigorously.
Stir in salt, then add the nuts and mix until combined.
Transfer to a bowl to cool and serve!
Notes
3.8g net carbs/serving
Nutrition information calculated by adding up macros of the individual ingredients and using walnuts for the nuts. Allulose not included in total or net carbs.
Growing up, one of my favorite holiday dishes was my aunts French toast rolls, cream cheese filled rolls with a crispy, cinnamon sugar coating. No matter how many she made, they were always gone by the end of the night.
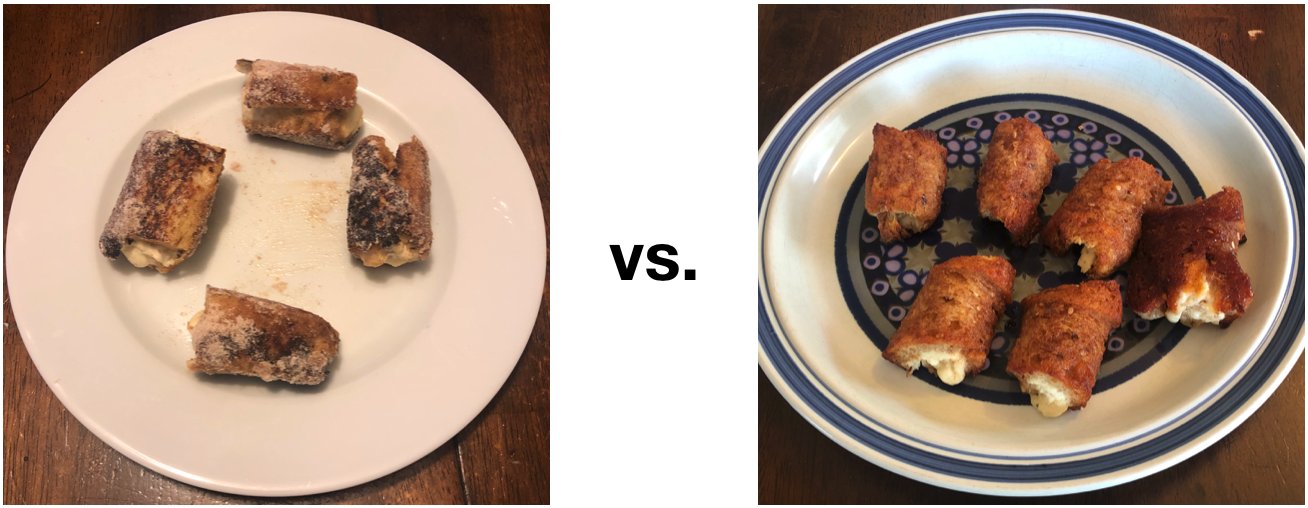
Just last week, I ran across a similar recipe on Food52, Pati Jinich’s French toast rolls (youtube, print). The main difference between the two was that my aunt’s recipe was baked and used a butter-based coating, while the Food52 version was pan-fried and used an egg & milk based coating.
Both sounded great, so I decided to compete them against each other.
The first step was to modify the recipes to be low-carb. To do that, I made the following changes:
Changed the cinnamon:sugar ratio to 1:4 (I prefer a stronger cinnamon taste)
Increased baking temperature to 400 °F to get a crispier outer layer.
Then I made the recipes, using the same batch of cream cheese filling (full recipe below). Both turned out fantastic. The sweetened cream cheese contrasts really nicely with the slightly savory bread and then the layer of crispy/sweet/cinnamon outer layer.
Detailed notes
Cooking:
The most labor intensive step was flattening the bread. Both recipes call for using a rolling pin, but I think a grill press would be a lot faster.
I overfilled the cream cheese, which led to some of the rolls unraveling during cooking. Still tasted good, but not as visually appealing. You really need only a thin layer of cream cheese (2-3 mm).
Low carb bread doesn’t absorb liquid as fast as regular bread. To adjust, just dip longer.
Convenience:
Both recipes were fairly easy to make, but the Food52 recipe cooks faster (~5 min. in the pan), while my family recipe is less labor intensive, especially in large quantities (~15 min. in the oven, but you can bake a lot at once).
My family recipe can be frozen before cooking, so you can make it ahead of time and then just bake right before serving. I tried this and it tasted exactly the same as fresh.
Taste & Texture:
The two recipes are similar, but my family recipe adds the cinnamon sugar before cooking, giving it a more intense flavor and a crispier texture.
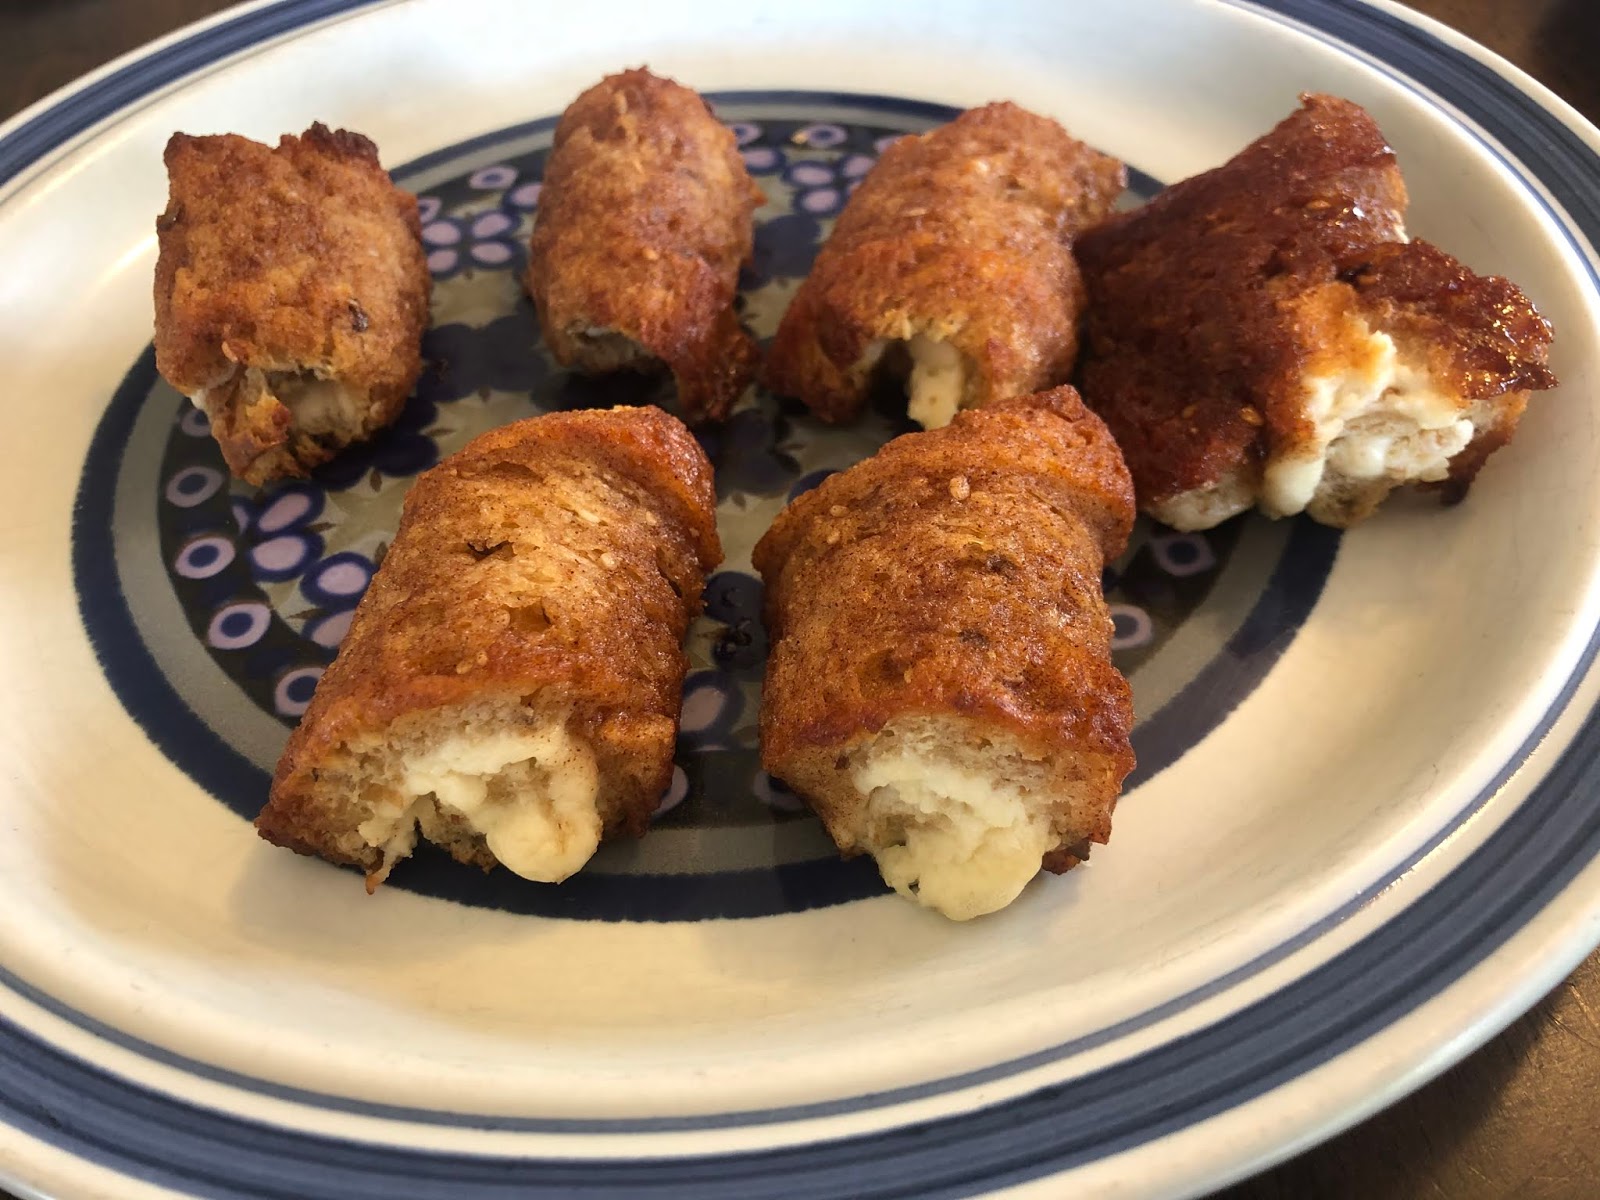
Overall, I significantly prefer the family recipe, both for taste and convenience, which I’m sure will make my aunt happy.
The winner! Zoomed in because they look great.
I’ve included both recipes below if you want to try them yourself.
Hope you enjoy it!
– QD
Low-Carb French Toast Rolls (Stovetop & Oven Baked)
Trim the crust from the bread and flatten with a rolling pin or grill press.
Mix sugar, cream cheese, and vanilla until homogeneous.
Spread ~1 tsp. of filling on each bread slice, roll tightly into a cylinder, cut in half, and set aside.
Mix together allulose and cinnamon to make the cinnamon “sugar.”
Stovetop
Whisk together egg, almond milk, vanilla, and salt.
Melt buter in a skillet over medium heat. Soak the rolls in the milk mixture until fully coated, add to the skillet, and cook until golden brown on all sides.
Toss each roll in the cinnamon mixture and serve warm.
Oven Baked
Heat oven to 400 °F.
Dip each roll in the melted butter, then roll in the cinnamon mixture. Rolls can be frozen at this stage until ready to bake.
Bake for 12-15 min., until heated through and browned.
Notes
0.7g net carbs per roll.
Nutrition information calculated for the oven baked recipe by adding up macros of the individual ingredients. Stovetop recipe is ~60 cal and 3.8g fat/roll, same carb and protein count.
This self-experiment is being done as part of the Keating Memorial Self-Research Project. A couple of other people from the Open Humans community are also running the same experiments. If you’re interested in joining in, let me know in the comments or send me a PM.
This post is an update on my experiments measuring the effect of food ingredients on blood sugar.
This week, I have the results from oat fiber and got started on whey protein.
Summary
Oat fiber has a negligible effect on my blood sugar, <0.05 mg/dL/g(oat fiber), or <0.5% that of glucose. Cooking the oat fiber had no significant effect. So, I’m safe to keep baking with it ☺.
Details
Purpose
To quantify the effect of ingestion of food ingredients and ingredient combinations on my blood sugar.
Procedure. From 7 pm the day before through 4:30p the day of experiment, no food or calorie-containing drinks were consumed and no exercise was performed. Non-calorie-containing drinks were consumed as desired (water, caffeine-free tea, and decaffeinated coffee). At ~12 pm, the substance to be tested was dissolved or suspended in 475 mL of water and ingested as rapidly as comfortable. For the cooked oat fiber, 100 g oat fiber was mixed with 200 g water and allowed to hydrate for 30 min. The mixture was then baked in a parchment lined muffin tin for 18 min. at 350 °F. The oat fiber was then suspended as described above. BGM measurements were then taken approximately every 15 min. for 2 h or until blood glucose had returned to baseline, whichever was longer. A final BGM measurement was taken 4.5 h after ingestion.
Measurements. Blood glucose was measured using a FreeStyle Libre flash glucose monitor and a FreeStyle Freedom Lite glucose meter with FreeStyle lancets & test strips. No special precautions were taken to clean the lancing site before measurement. To take a sample, the lancing devices was used to pierce the skin at an ~45 deg. angle from the finger. Blood was then squeezed out by running the thumb and pointer finger of the opposite hand from the first knuckle to the lancing site of the finger. Blood was then wicked into a test strip that had been inserted into the meter and the glucose reading was recorded.
Data Processing & Visualization. iAUC was calculated using the trapezoid method (see data spreadsheet for details). Data was visualized using Tableau.
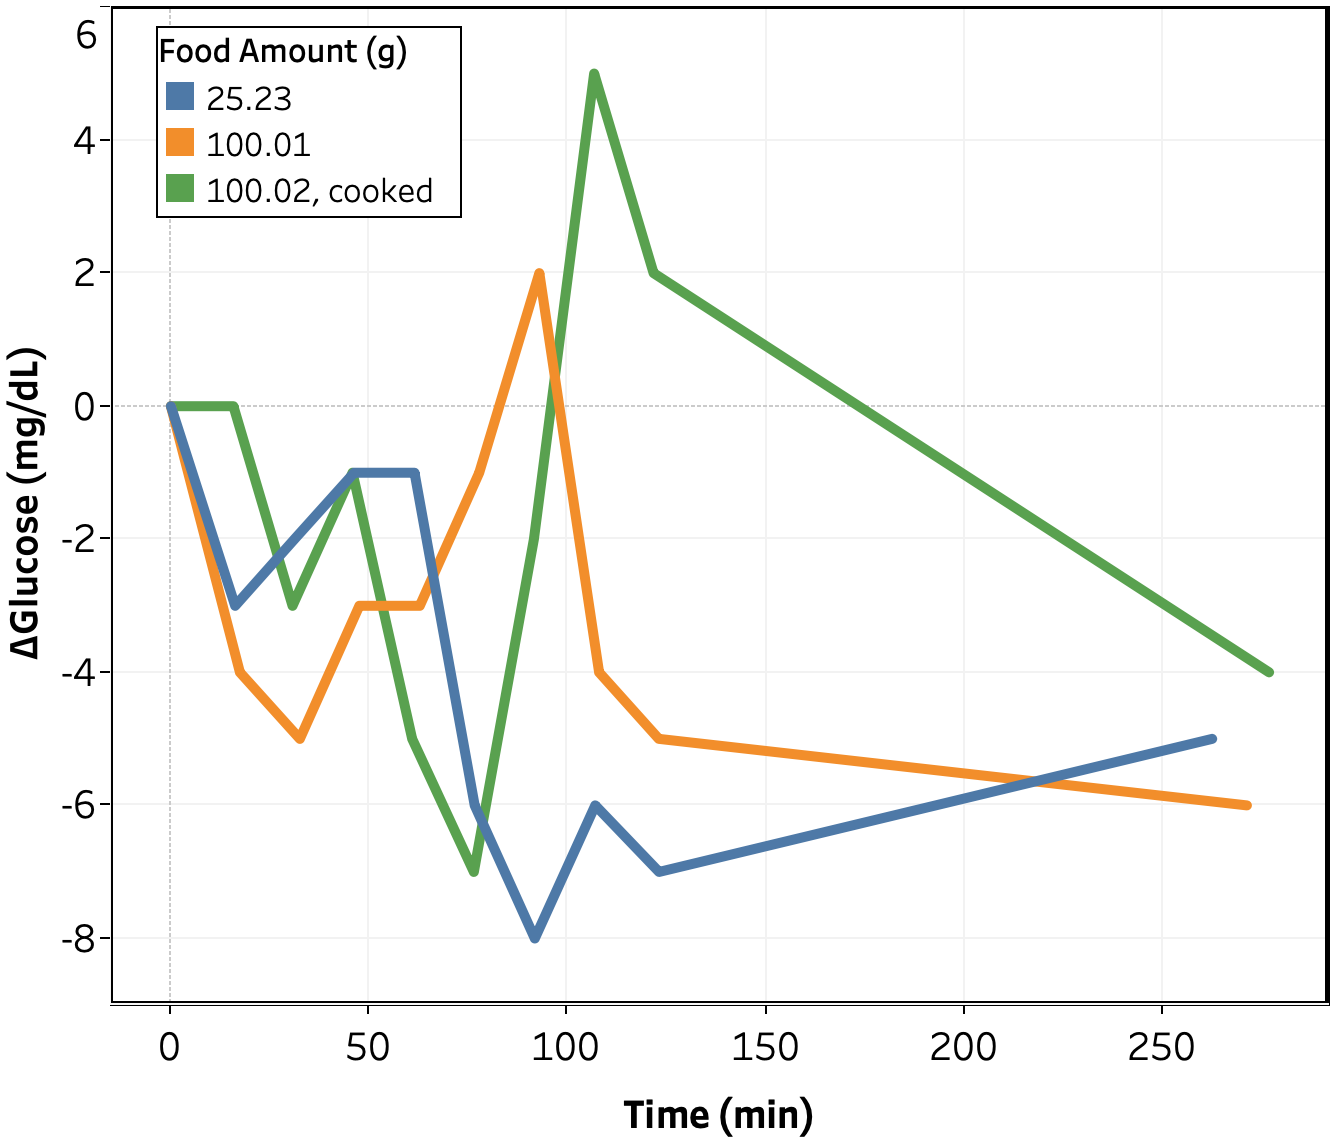
Figure 1. Change in blood glucose vs. time for oat fiber tests.
Change in blood glucose as a function of time for the oat fiber tests is shown in Figure 1. Qualitatively, there appears to be no impact of oat fiber up to 100 g consumed. It was extremely uncomfortable to drink that much oat fiber in one sitting, so it’s unlikely I will ever eat more than that.
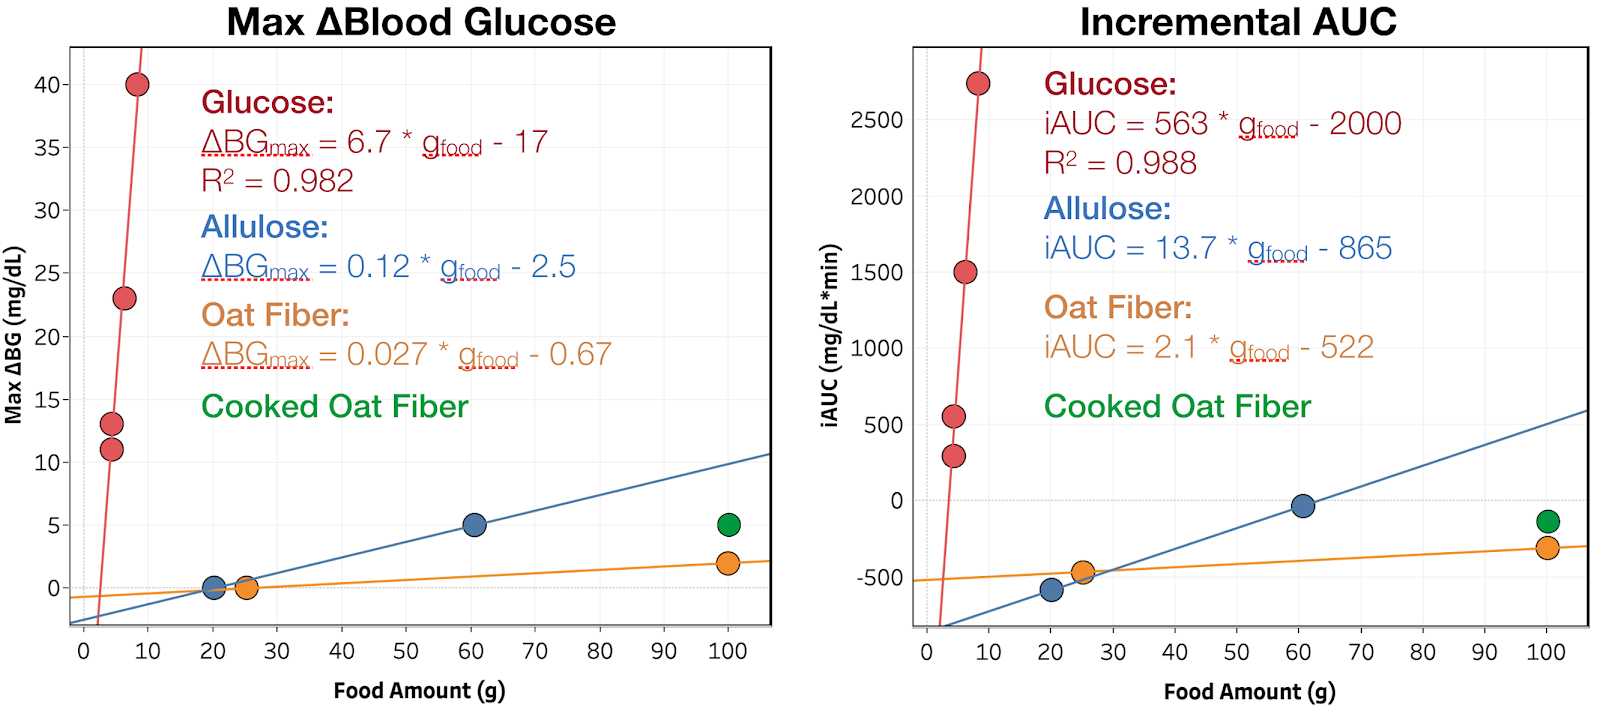
Figure 2. Maximum blood glucose increase and iAUC vs. amount consumed. Red, blue, orange, and green indicate glucose, allulose, oat fiber, and cooked oat fiber, respectively. The line is the best linear fit to the data.
To better quantify the impact of glucose on my blood glucose, I plotted the maximum increase in blood glucose and the iAUC of blood glucose (incremental area under the curve) vs. amount consumed for all ingredients tested so far (see Figure 2). While the oat fiber data shows an increase in both blood glucose and iAUC as a function of amount consumed, there’s only two data points and the magnitude is extremely small and could easily be due to experimental error. Confirming this effect would require running more measurements. I may go back and do this later, but for the moment, I would prefer to focus my time on ingredients with unknown or more substantial effects.
Since oat fiber is used in baking, I also wanted to check if heating it would break down the fibers and increase digestibility. Towards that end, I mixed 100 g of oat fiber with 200 g of water and baked at 350 °F for 18 min. (time & temperature for my muffin recipe and longer than my cookie recipe), then suspended it in water using the same procedure as with the uncooked fiber. There was no observable change in appearance, taste, or texture from the cooking process. There was a very minor increase in blood glucose response, but well within the measurement error of the meter.
Conclusion & Next Experiments
Oat fiber has a negligible effect on my blood sugar, <0.05 mg/dL/g(oat fiber), or <0.5% that of glucose. Cooking the oat fiber had no significant effect. This week, I will measure the effect of whey protein, a common protein supplement.