Get new posts by email or rss feed
From my two days of “continuous” tracking, I saw sharp drops in blood sugar during cardio exercise, followed by a return to baseline over 30-45 min. During these drops, I was going extremely low, almost 40 mg/dL. I didn’t have any physical symptoms that I could tell, but this worries me enough that I want to understand the phenomenon better and see if there’s a way to mitigate it.
Towards this end, over the last week, whenever I exercised, I measured my blood glucose before and at 15 min. intervals after exercise until my BG had recovered to baseline or I did something that would change my BG (ate, took medicine, etc.).
Key Learnings:
- The drop after exercise is large and significant, averaging 25 mg/dL for a 200 kCal bike ride and 10 mg/dL for MMA and strength training.
- With one exception, whenever I could measure, my BG recovered to baseline within 45 min. and usually started to come back up within 15 min.
- This indicates I’m not in any danger with my current exercise regime, but should reassess if I significantly change the intensity, duration or type of exercise.
- There are no clear trends in the magnitude of the drop of recovery time with anything I measured, but there are hints of effects with intensity, time of day, and type of exercise. I need to collect more data.
Next Experiments:
I’m always interested in ideas for new experiments, so please leave a comment if there’s something you’d like me to try.
- Exercise studies: Continue to collect data, varying intensity and type of exercise to try to figure out trends.
- Long peak from breakfast & lunch: Measure blood glucose at 15 min. intervals a few more times after breakfast & lunch. Try varying protein and fiber content to see if those are the causes. Try normal-acting insulin to mitigate.
- Food & medication studies: It’s proving difficult to disentangle the numerous effects going on at any given meal by adding or subtracting particular foods (data too noisy, too many measurements required to observe a statistically significant effect). Instead:
- Skip meals and medication to measure background trends.
- Consume individual ingredients (glucose, protein, fiber, etc.) or take individual medications to measure their direct effects.
- Measure combinations of ingredients and medications to measure interaction effects.
- This will require more experiments, but I think in the end it will require less time & effort
Details
Purpose
Determine the short term effect of exercise on my blood sugar and if I am in danger of a severe hypoglycemic event.
Design/Methods
General. Blood glucose was measured using a FreeStyle Freedom Lite glucose meter and FreeStyle lancets & test strips. No special precautions were taken to clean the lancing site before measurement. To take a sample, the lancing devices was used to pierce the skin at an ~45 deg. angle from the finger. Blood was then squeezed out by running the thumb and pointer finger of the opposite hand from the first knuckle to the lancing site of the finger. Blood was then wicked into a test strip that had been inserted into the meter and the glucose reading was recorded.
Measurements were taken before exercise and at 15 minute intervals after exercise until my blood sugar had returned to the baseline value or I did something that would change my BG (ate, took medicine, etc.).
Recovery time was calculated as the time until blood glucose returned to within 5 mg/dL of the value before the start of exercise.
For bicycling, I used a stationary bike and recorded the reported calories burned. This is almost certainly inaccurate, but appears to be a consistent function of the pedaling speed and resistance setting. As such, I used it as a quantitative measure of the intensity of the exercise.
Data
Results & Discussion
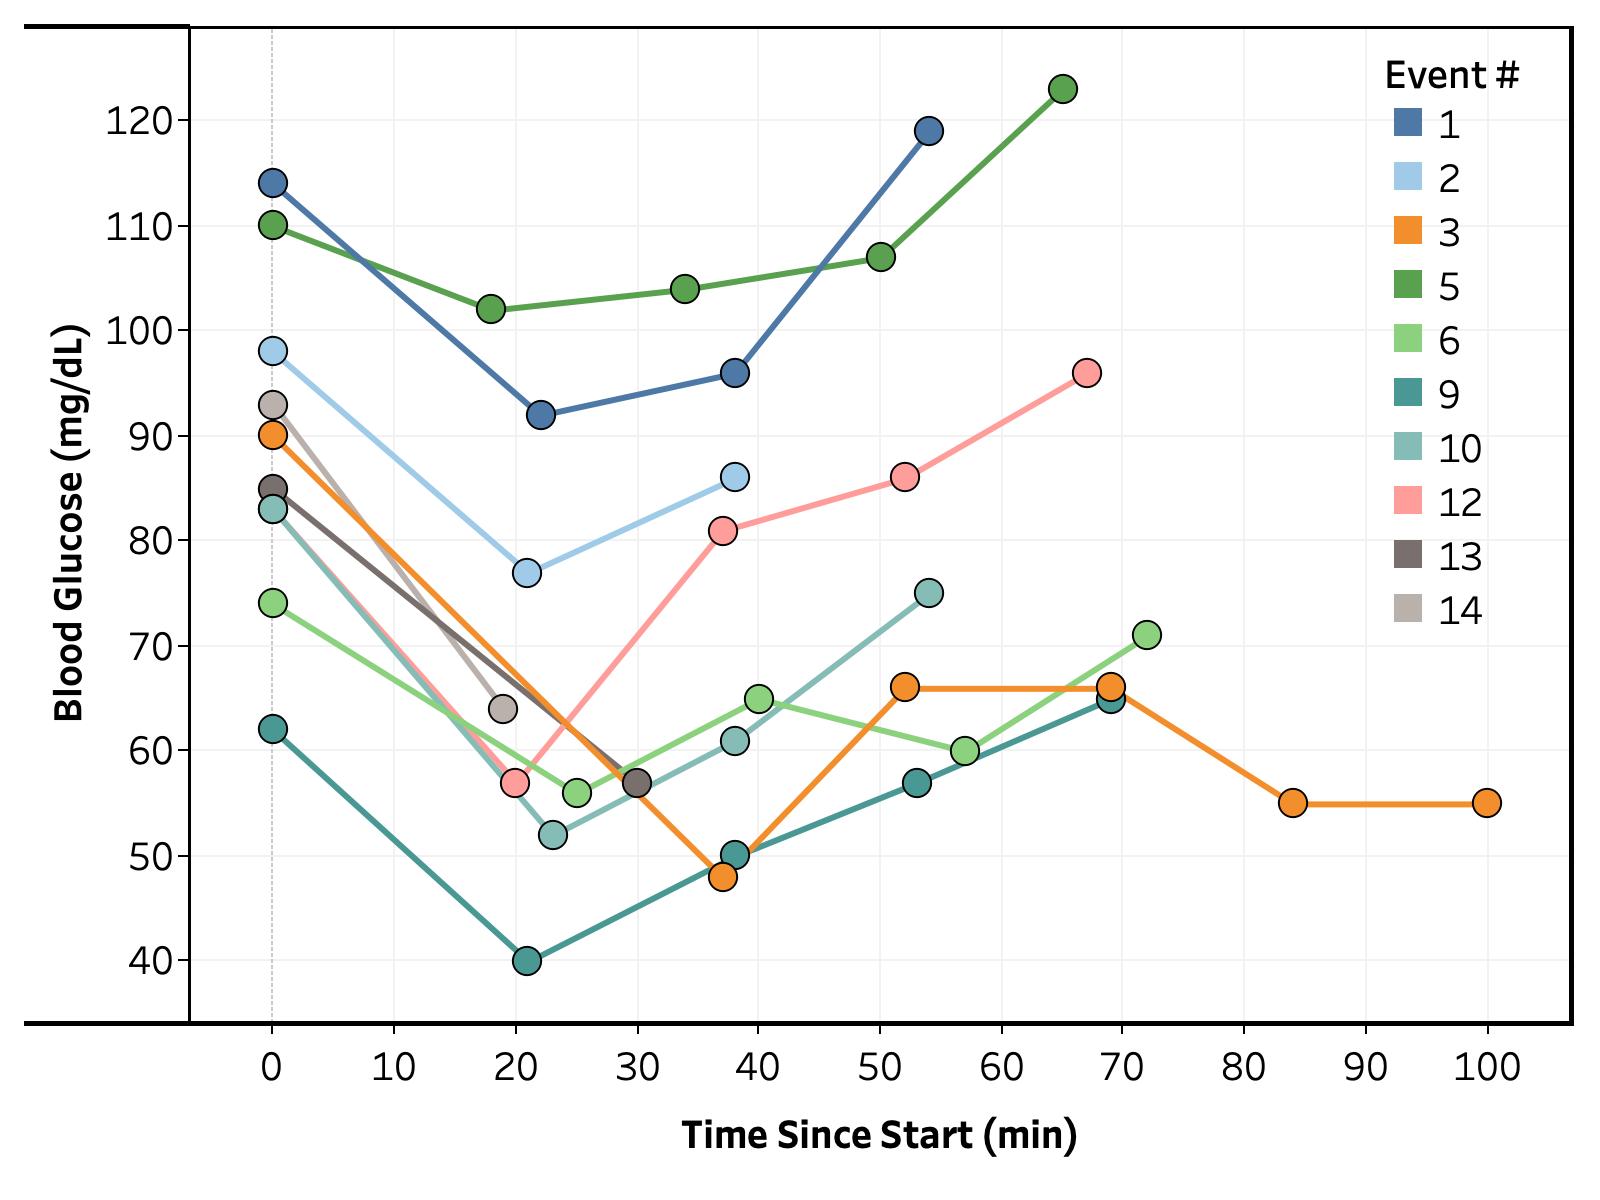
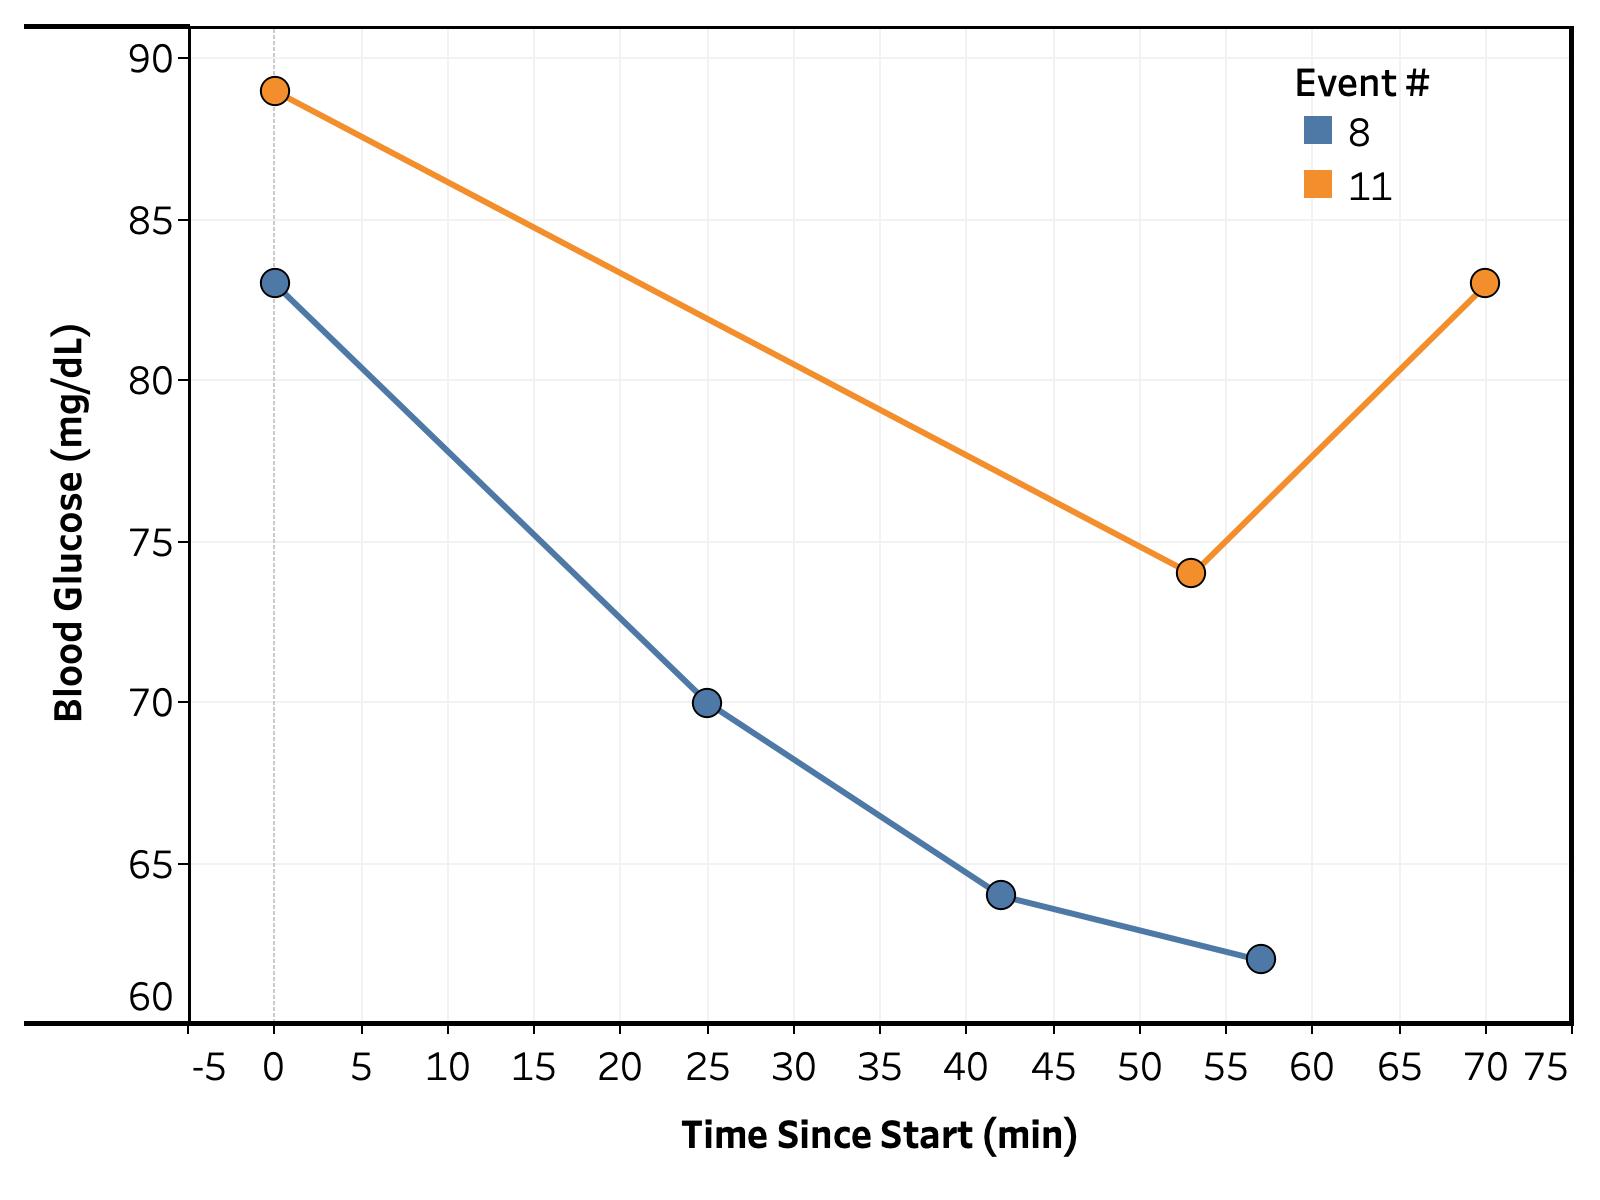
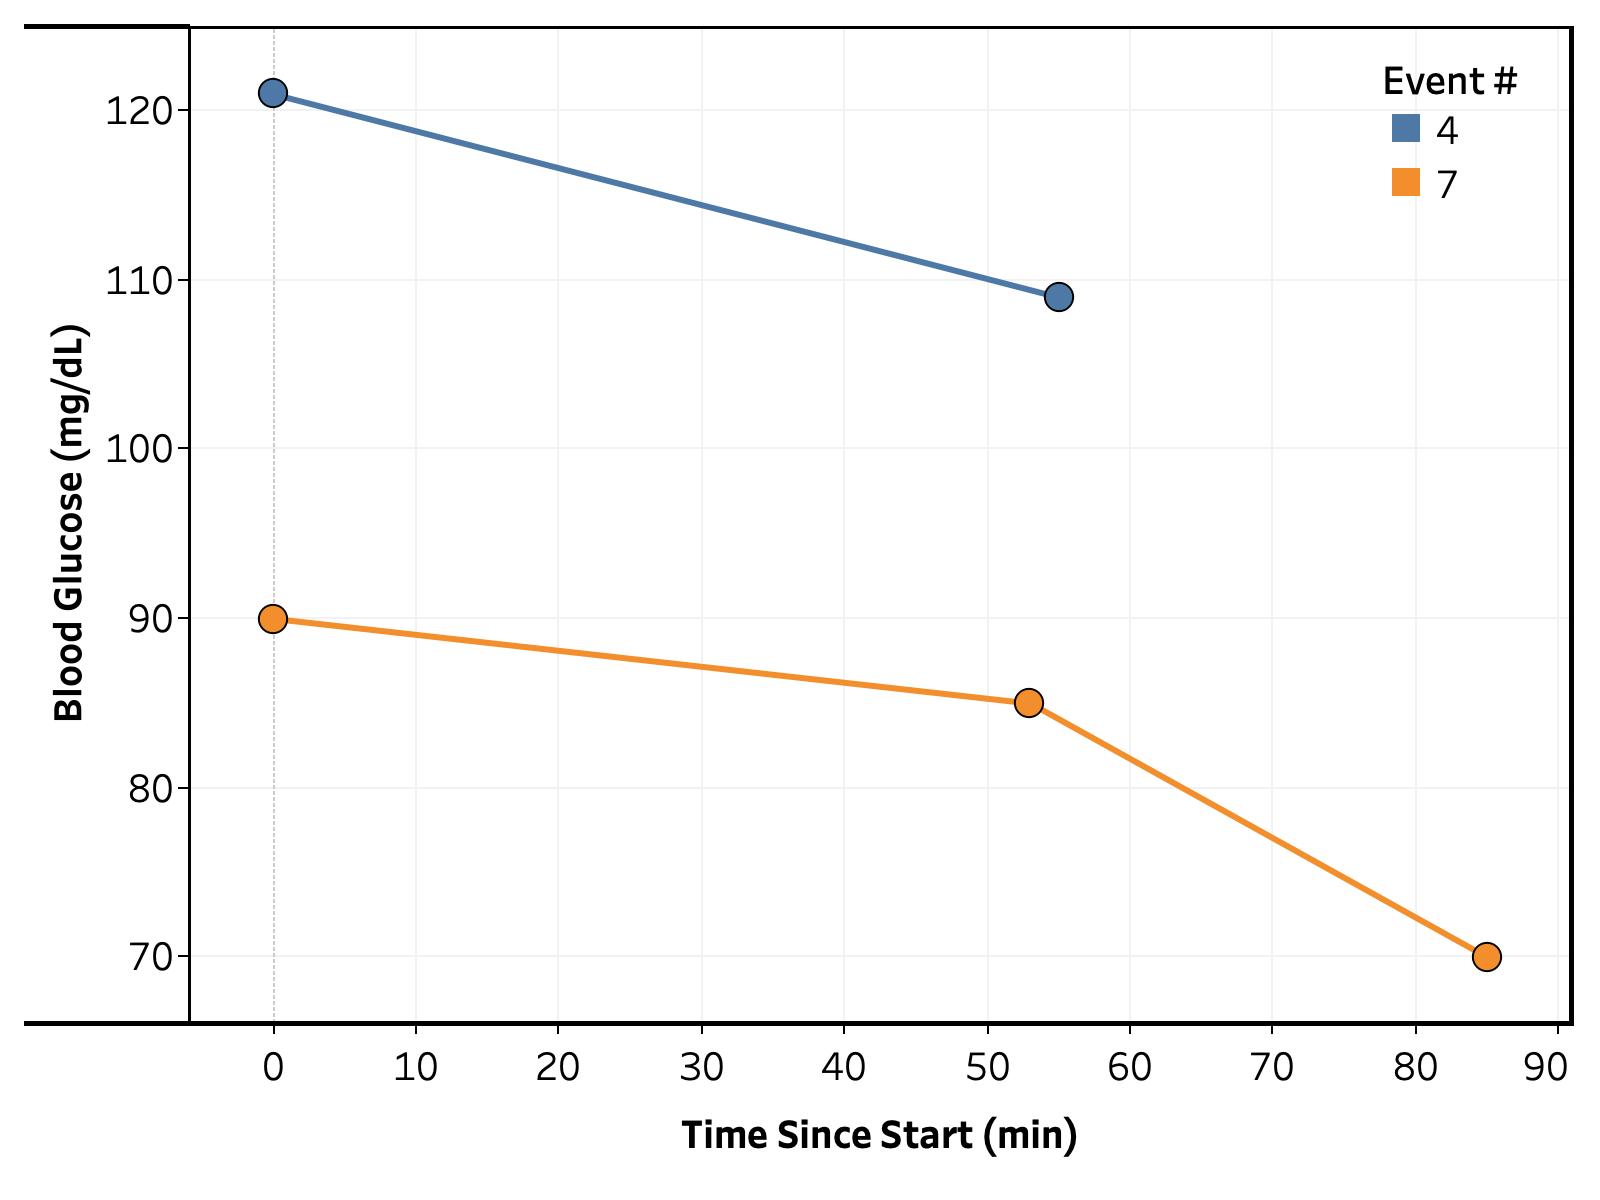
Overall. The full set of BG vs. time traces are shown in Figures 1, 2, and 3. The data roughly corresponds to the previously observed trend, a drop in BG during exercise followed by recovery over 15-60 minutes. To get a better understanding of what’s going on, I calculated the change in blood glucose from the initial measured value and bucketed readings in 15 minute intervals from the end of exercise (i.e. 15, 30, 45, and 60 min. post-exercise).
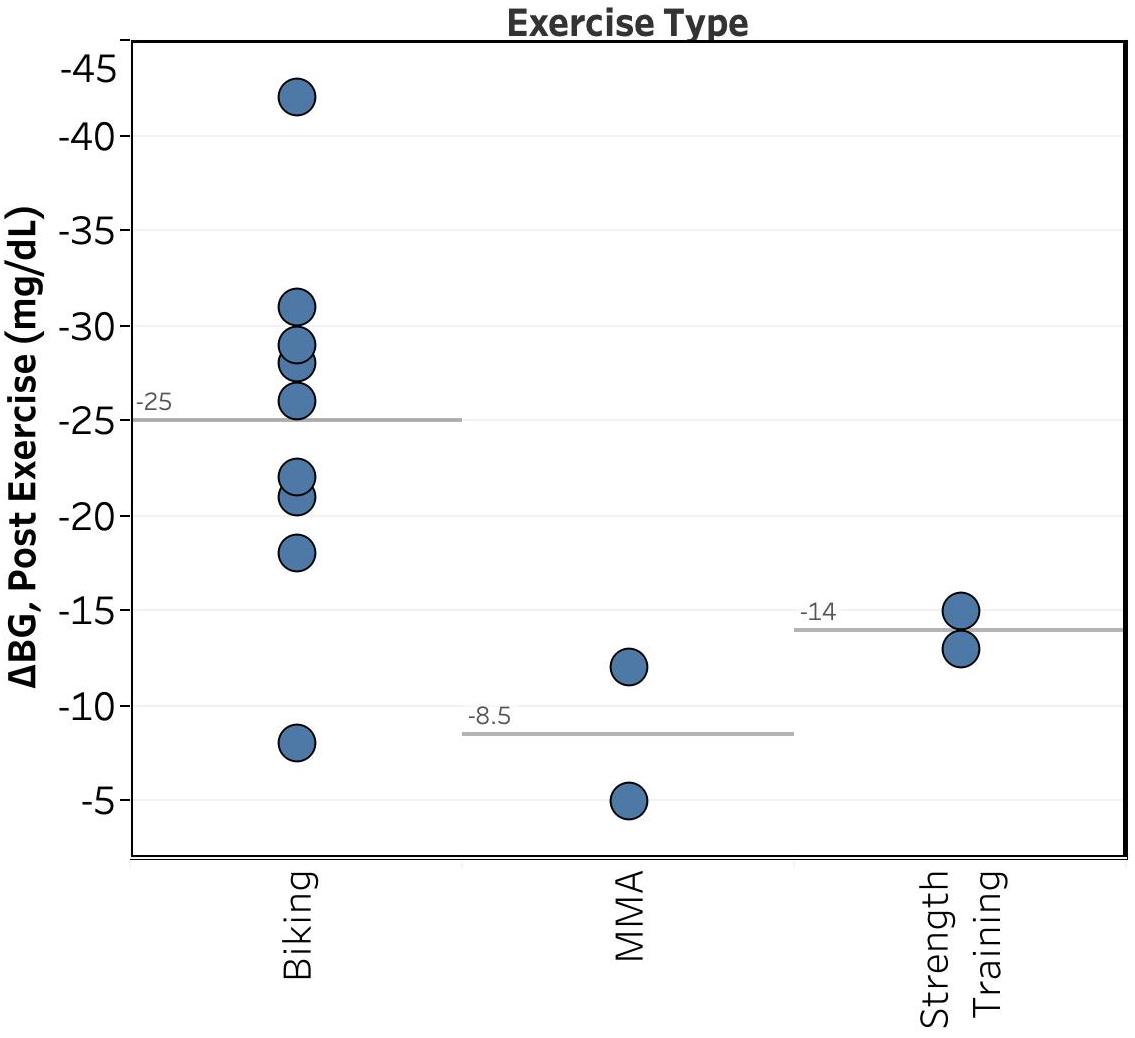
Type of Exercise. Unsurprisingly, as shown in Figure 4, the type of exercise had the largest effect on the magnitude of my drop in BG, with biking showing an average drop of 25 mg/dL and MMA & strength training showing average drops of ~10 mg/dL.
Unfortunately, it’s difficult to draw any conclusions from this, as I do different types of workouts at different times of day (e.g. MMA on weekday mornings, biking & strength training on weekend mornings or weekday evenings).
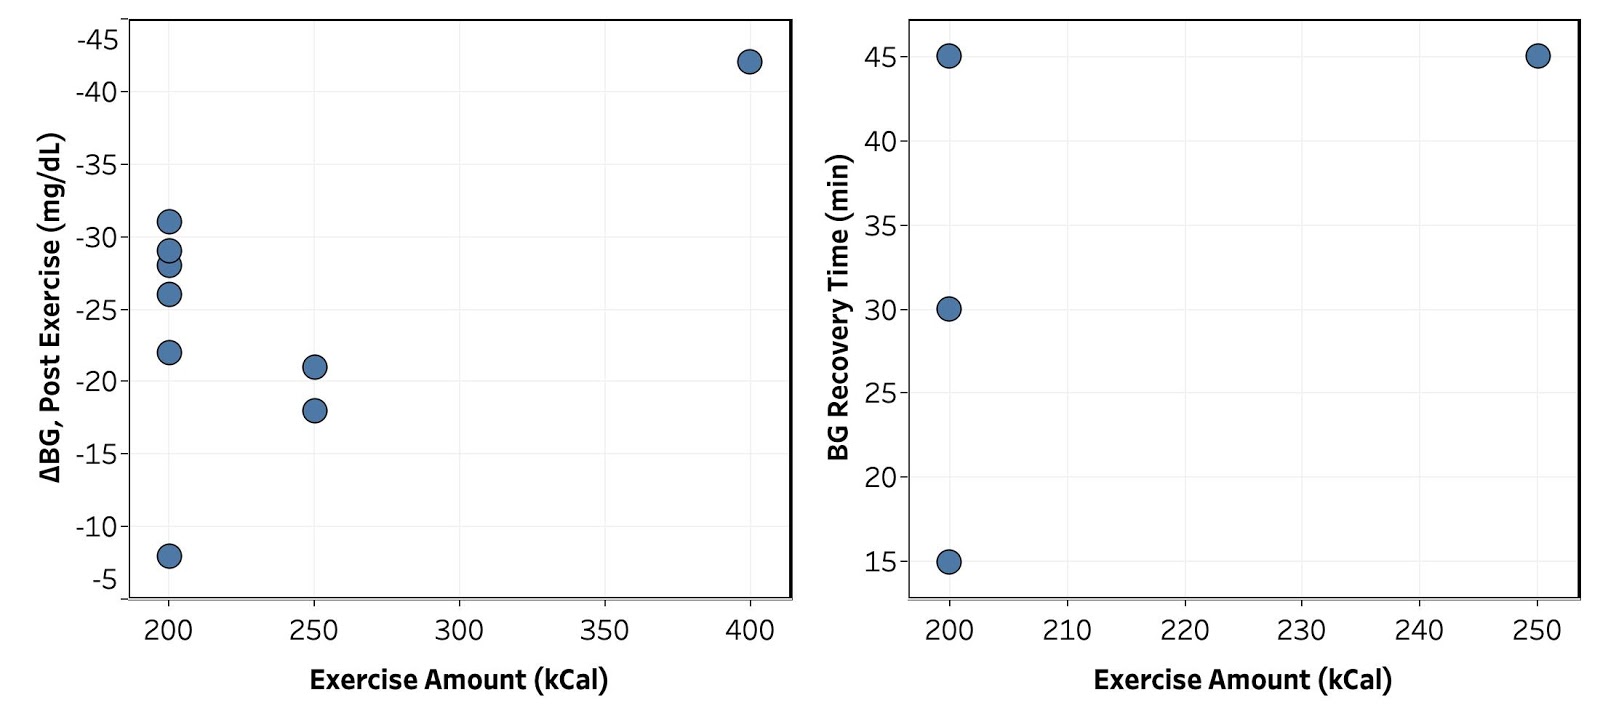
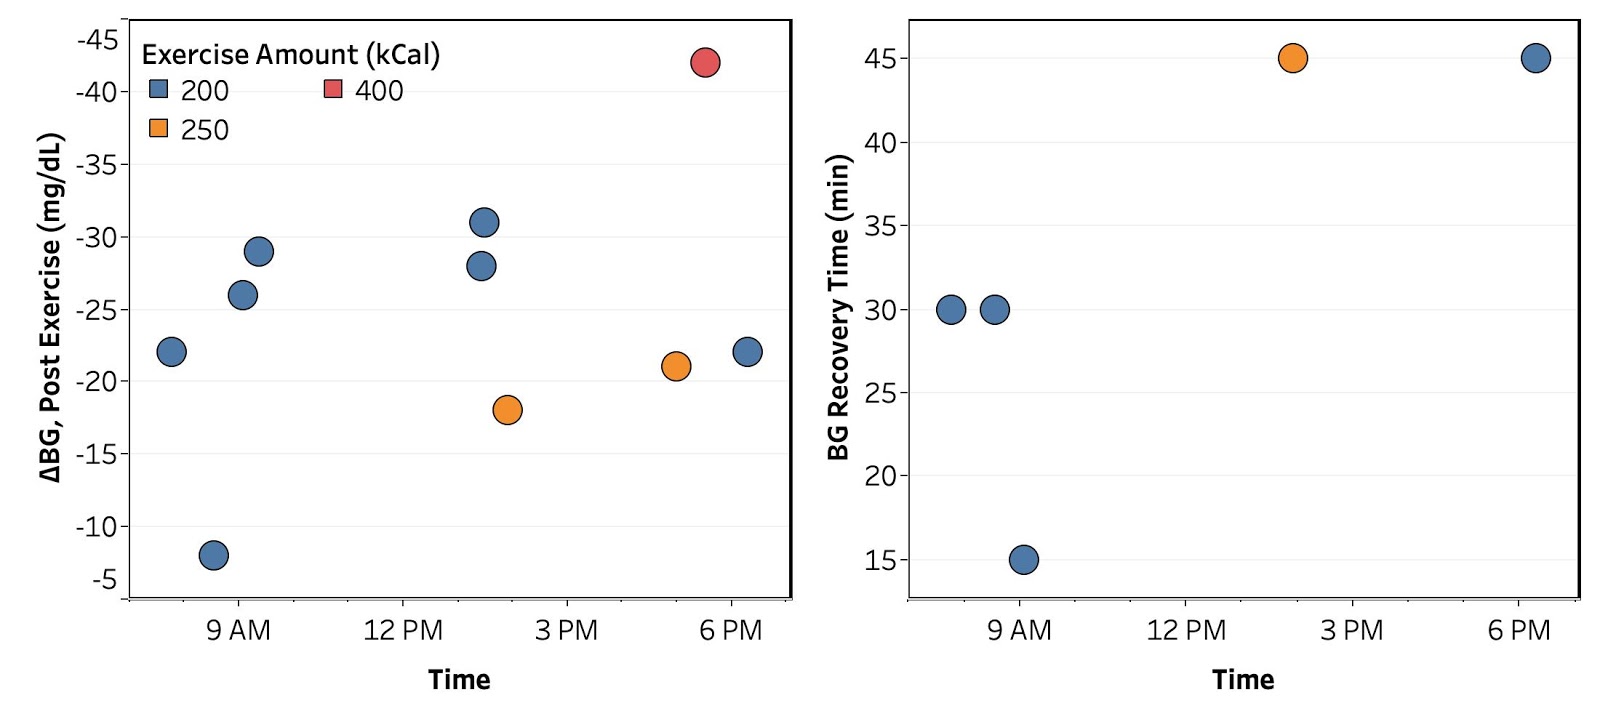
Exploratory Analysis of Trends. I next attempted to see if there were any trends in the BG effect with intensity of exercise, starting BG, or time of day. As shown in Figures 5, 6, 7, and 8, the amount of data I have so far is not sufficient to determine any clear trends. However, a there are hints of a few possibilities:
- Figure 5: Initial BG drop may be positively correlated with exercise intensity. This conclusion relies on a single data point from a 400 kCal bike ride and so is highly suspect.
- Need to get more data at different intensities. May also need a better measure of intensity. Maybe look at both kCal and duration of ride?
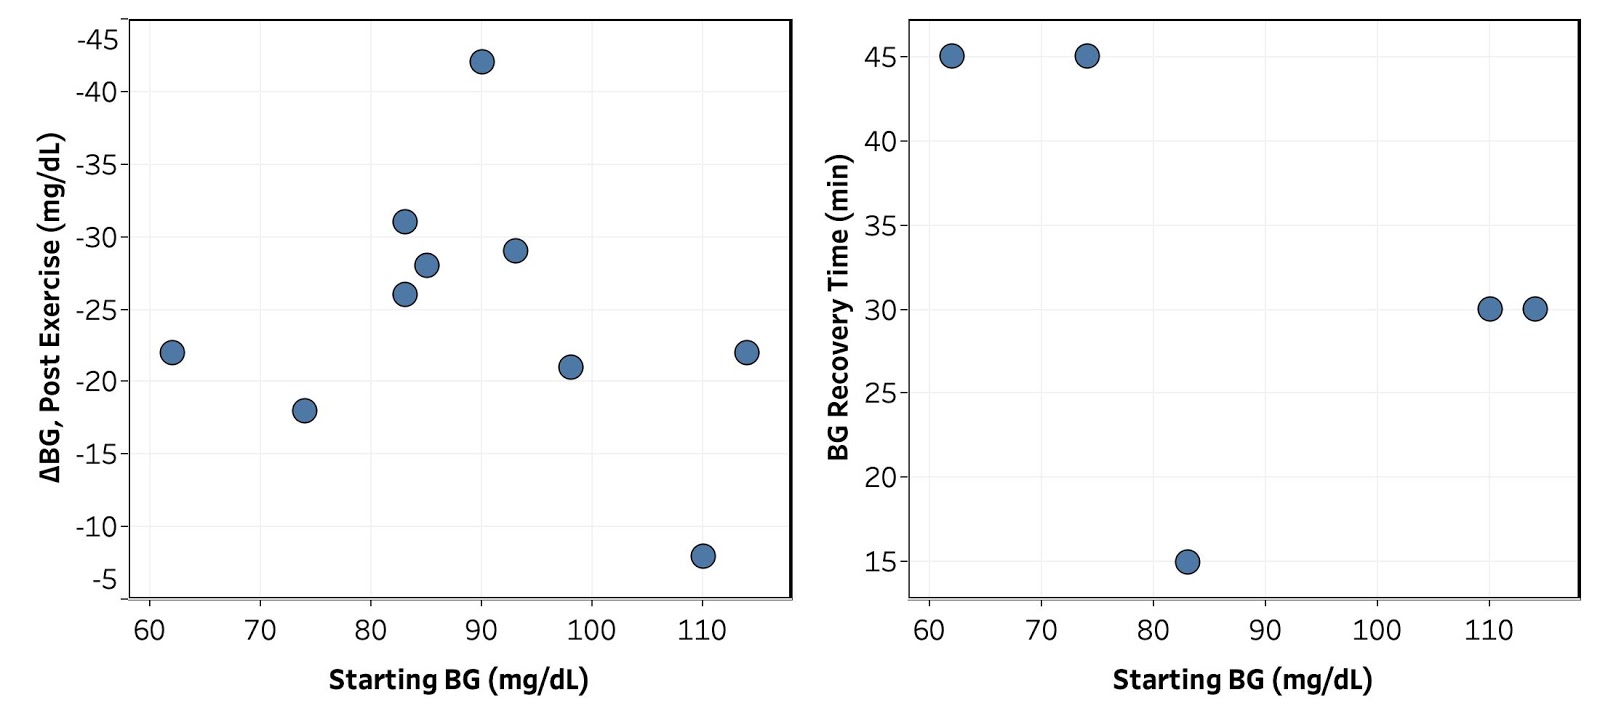
- Figure 6: Initial BG drop and recovery time show a maximum and minimum, respectively, when initial BG is close to “normal” (80-95 mg/dL). Again, not nearly enough data to have any confidence in this conclusion, but worth looking at again when I have more data.
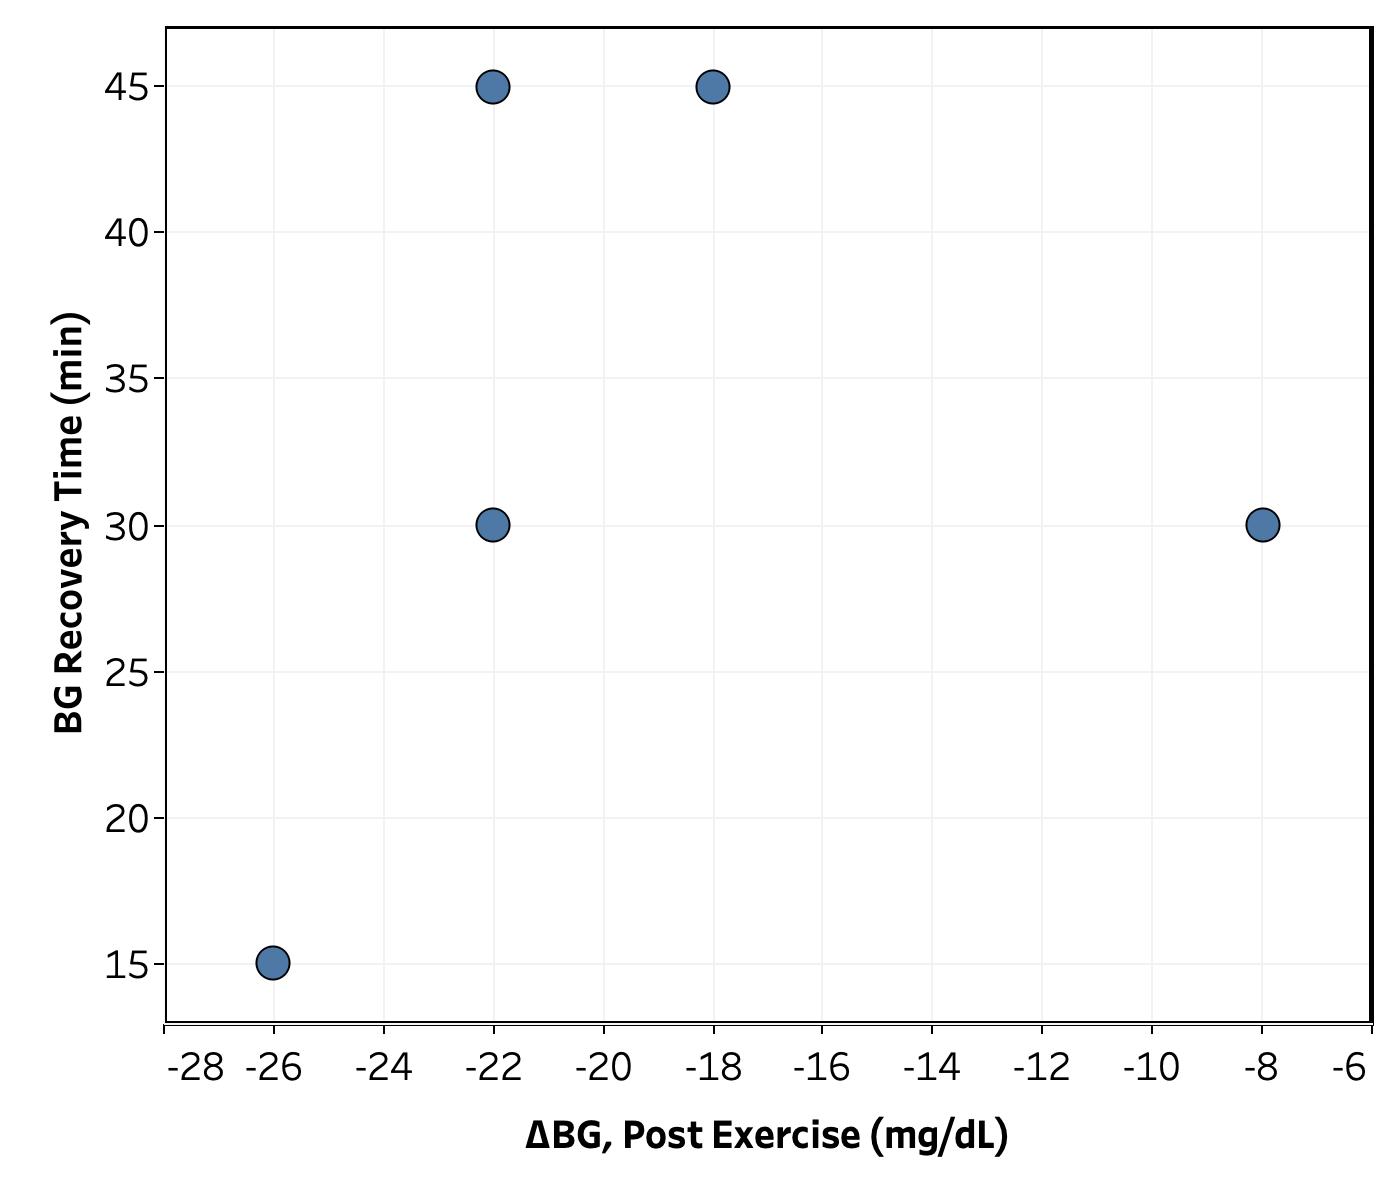
- Figure 8: With one outlier, recovery time increases as the BG drop gets smaller. This is a counterintuitive to me and also worth keeping an eye on.
Conclusion
See summary above. All-in-all, this initial data is promising and allays my worry about a dangerous hypoglycemic event during exercise, but I need to get more data in order to get anything interesting out of it. I’ll keep monitoring and post again when I’ve learned more.
– QD