Final Results: Hot Shower Effect on Blood Glucose (Community Self-Experiment)

Get new posts by email or rss feed


This post is the final report on our Community Self-Experiment studying the effect of hot showers on blood glucose. If you don’t want to read all the details, the highlights are in the Background & Summary section immediately below. 

Thanks to the whole team for all the work they put in figuring out the protocol, running the experiments, and analyzing the data: u/NeutyBootyu/jrdeutschu/analphabruteu/bradbitzeru/taviriou/sean101v, and u/white5had0w


Background

On 1/28/20, u/NeutyBooty posted on how hot showers caused their blood glucose to rise. Lot’s of commenters confirmed the general observation, but some thought it was a CGM artifact, some said it matched their finger-stick meter, and others said they saw a BG drop instead of a rise. In our interim report, u/tzatza pointed out several literature reports showing BG increasing with increasing body temperature, though I was unable to find any studies that specifically looked at the effect of showering.

To figure out what’s really going on, we decided to do a communal self-experiment. 8 Redditors with diabetes developed an experimental protocol, measured their blood glucose before and after 41 showers using a combination of CGMs and BGMs, and analyzed the results. 


Summary of Results

By working together, the team of experimenters was able to learn more and learn faster than any one of us would have been able to on our own. From the data, we were able to answer several of our initial questions:

  • What is the change in blood glucose after a hot shower under controlled conditions?
    • From BGM: 12 ± 17 mg/dL
    • From CGM: 21 ± 15 mg/dL
  • Is the observed change in blood glucose real or a CGM sensor artifact?
    • The change is real, not a sensor artifact (change is observed with BGM; CGM measurements are consistent with typical variation between CGM and BGM)
    • We cannot rule out the difference in effect size between BGM and CGM being due to a sensor artifact, but the data does not provide support for this hypothesis.
  • Is there significant person-to-person variation in the magnitude or direction of the effect?
    • The data is consistent with person-to-person variation, but significantly more data and/or more controlled conditions are required to determine if the variation exists and it’s effect size.
  • Is the change in blood glucose cause by the hot shower?
    • We can not identify any factors that account for the blood glucose rise other than the shower, but would need significantly more data and/or more controlled conditions to be certain that the shower is the cause.

While we were not able to get firm answers to all of our questions, we did get a measure of the effect size and rule out it being a CGM sensor artifact (the leading hypothesis in the original post). We also learned a lot that will help guide future Community Self-Experiments.


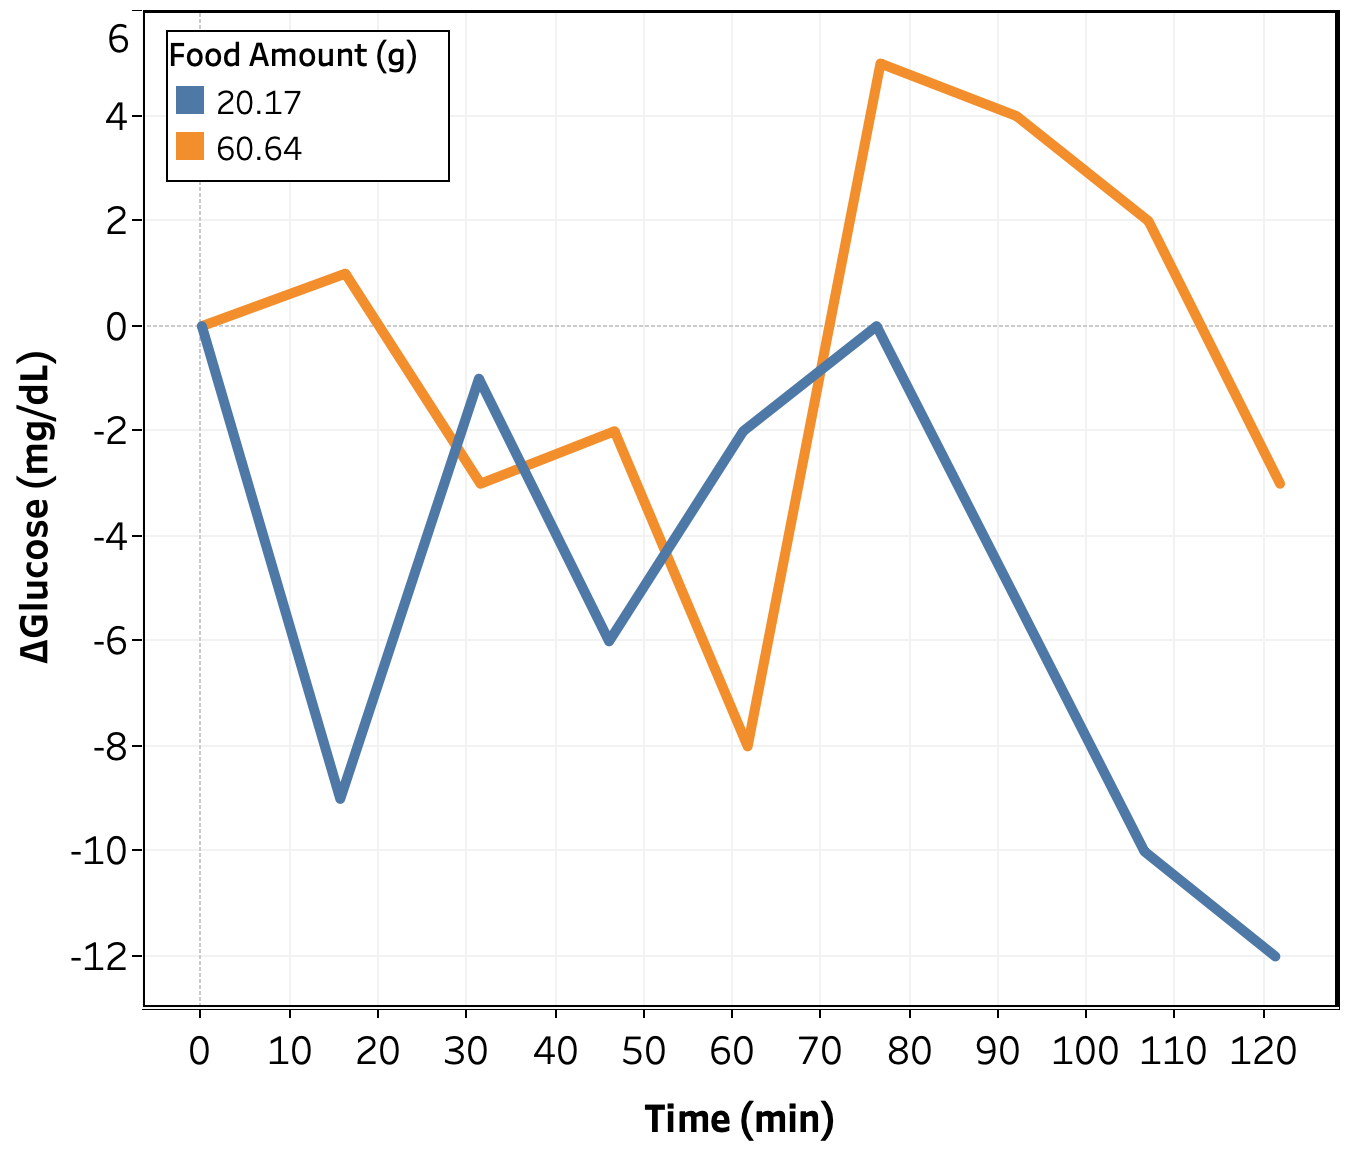
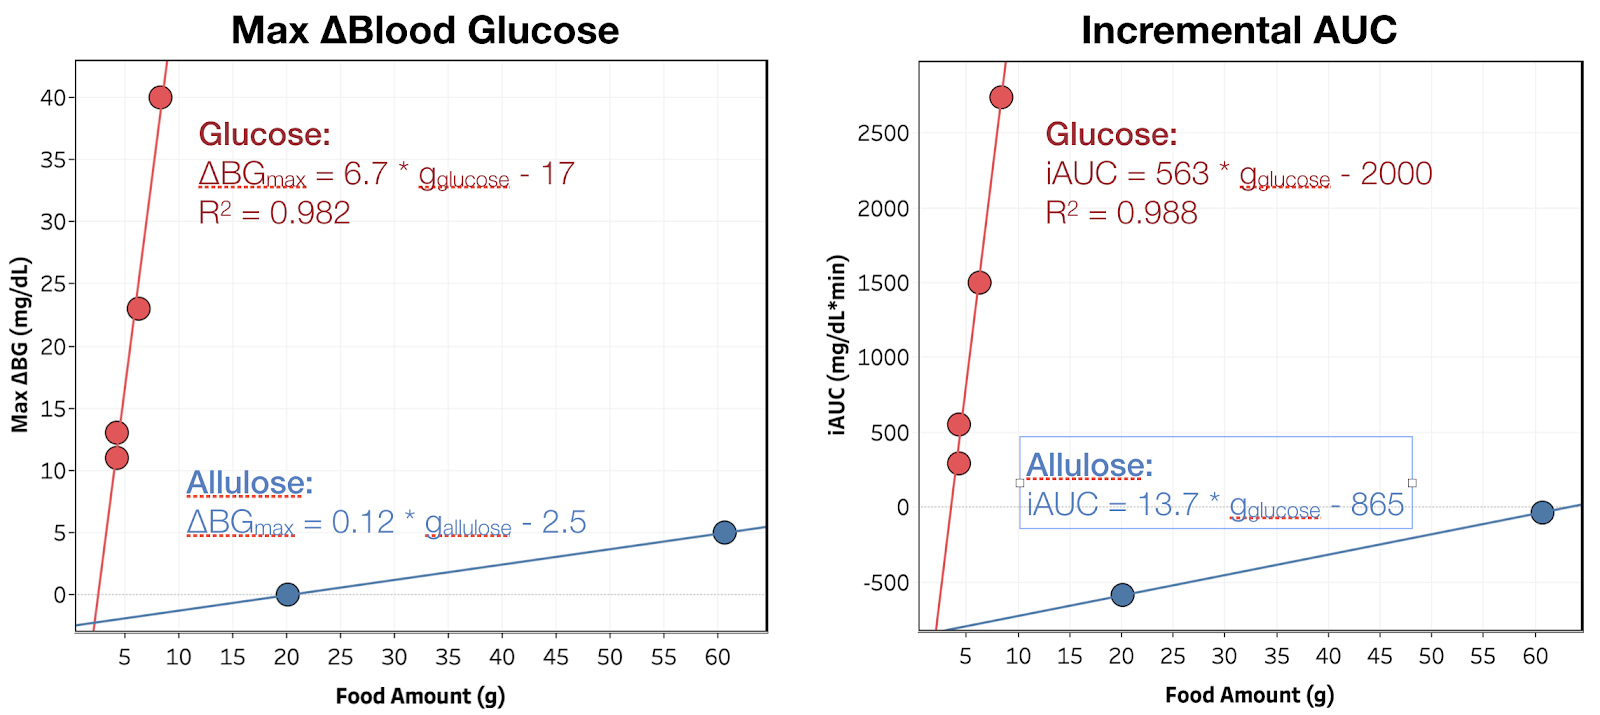
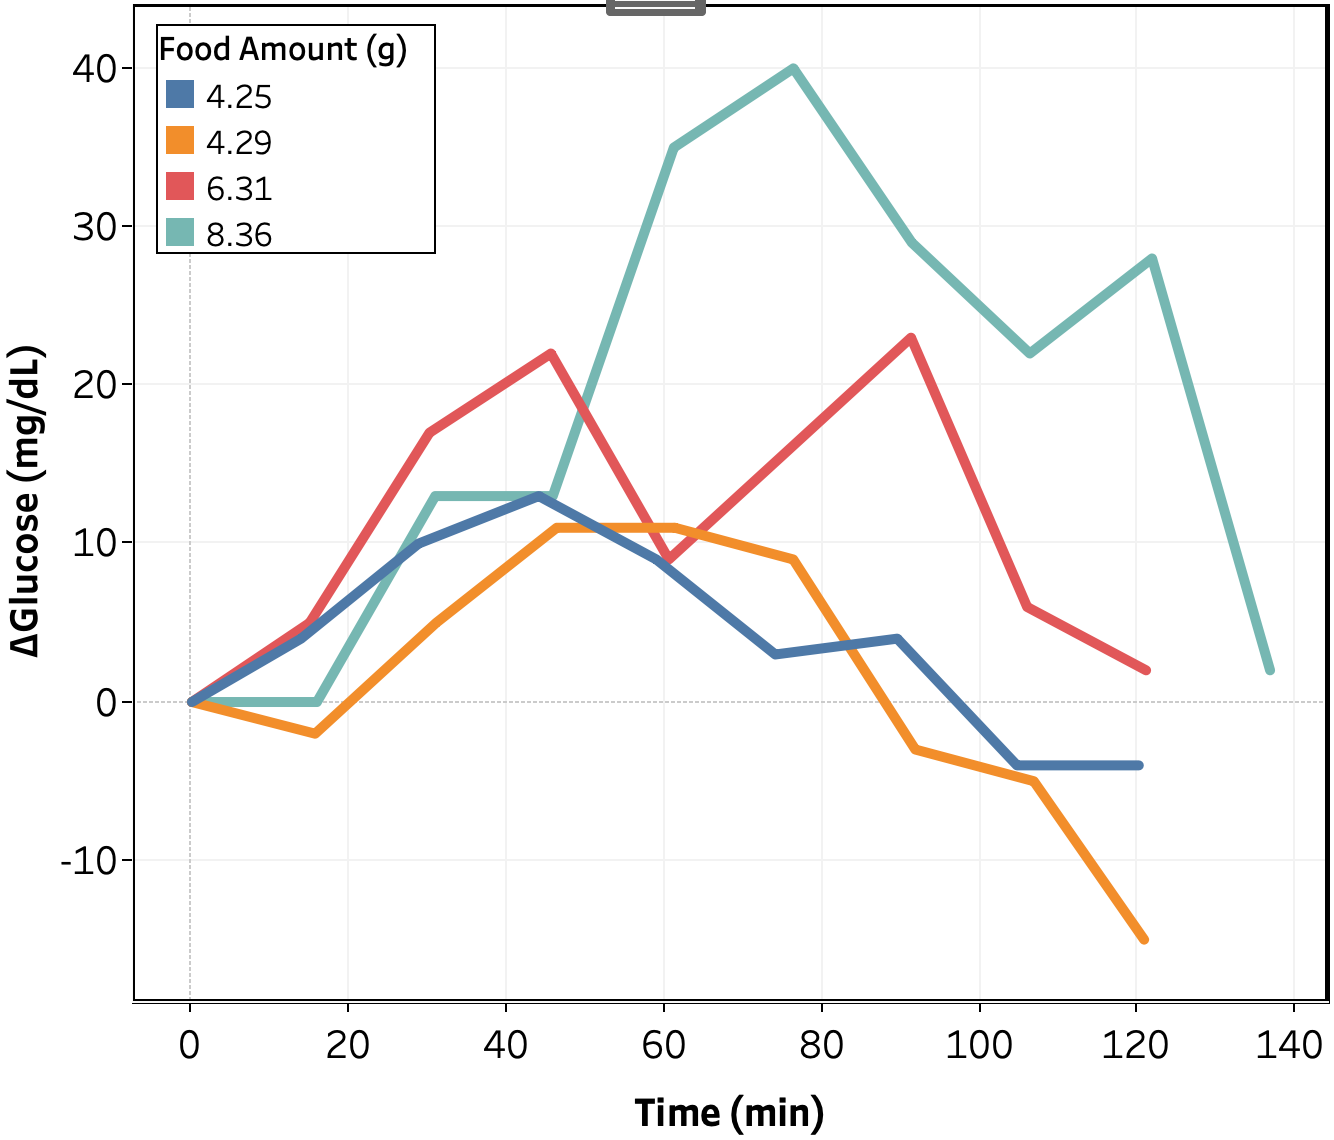
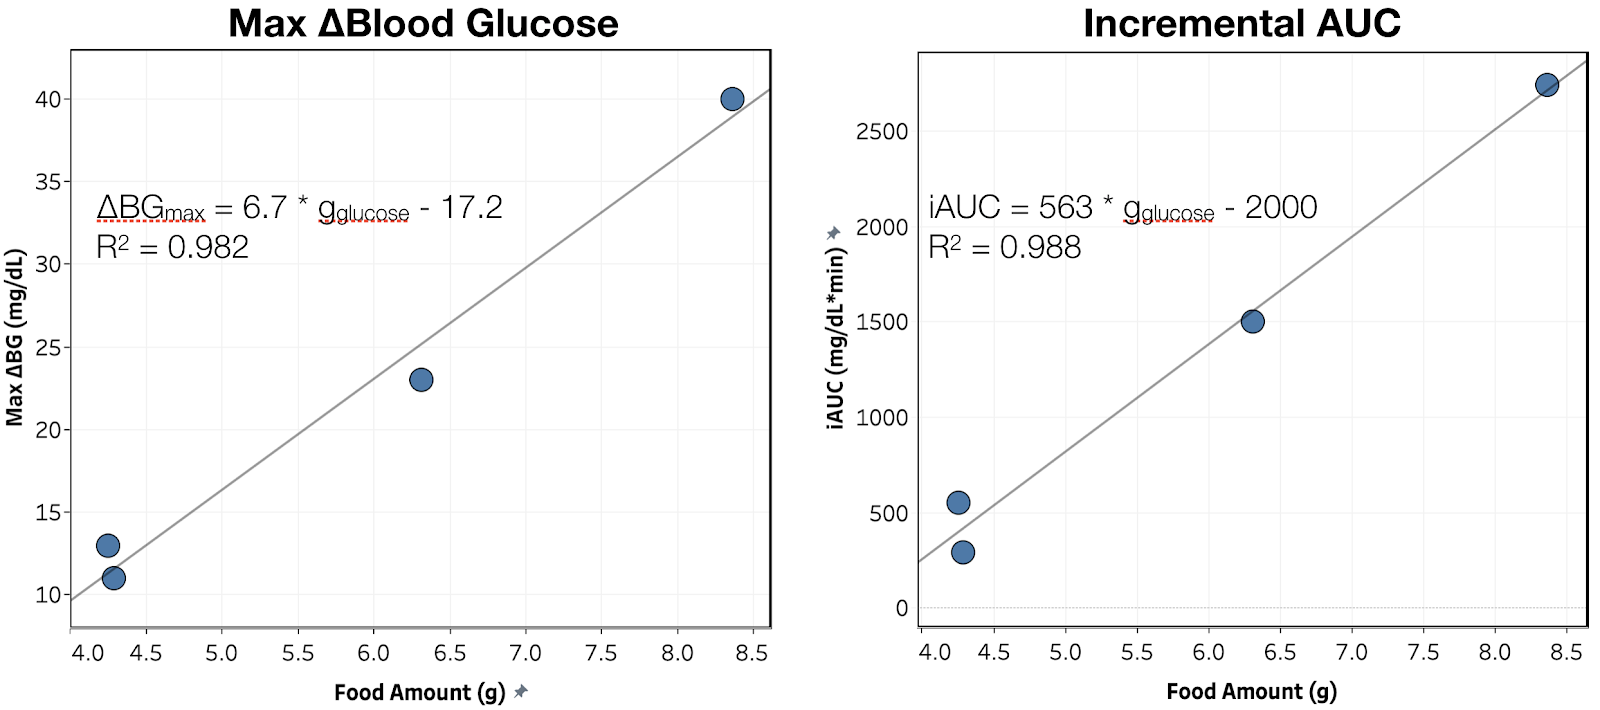
Overall, we consider the experiment a success and plan to do more community experiments. The next one is a study to measure the effect of food ingredients and combinations on blood sugar (especially those used in low-carb diets). If you’re interested in joining in, let me know in the comments or send me a PM. 


Initial Questions

When designing the study, we had four questions we wanted to answer:

  1. What is the change in blood glucose after a hot shower under controlled conditions?
  2. Is the observed change in blood glucose real or a CGM sensor artifact?
  3. Is there significant person-to-person variation in the magnitude or direction of the effect?
  4. Is the change in blood glucose cause by the hot shower?

Experimental Design/Methods

Procedure. Protocol here. 

Data Processing. All data was converted into consistent units and put into an excel spreadsheet. From the raw data, I calculated change in BG from start of shower, as well as the largest relative change, and the time until largest relative change (see spreadsheet for calculation details). Visualization was done using Tableau.


Data

Raw data (anonymized)


Analysis

What is the change in blood glucose after a hot shower under controlled conditions?

To answer this question, I plotted largest observed change over the 1 hour monitoring period for each shower as measured by both BGM and CGM (see Figure 1).

Figure 1. Max ΔBGM & ΔCGM for each shower, colored by experimenter. Reference band shows average +/- 1 standard deviation.

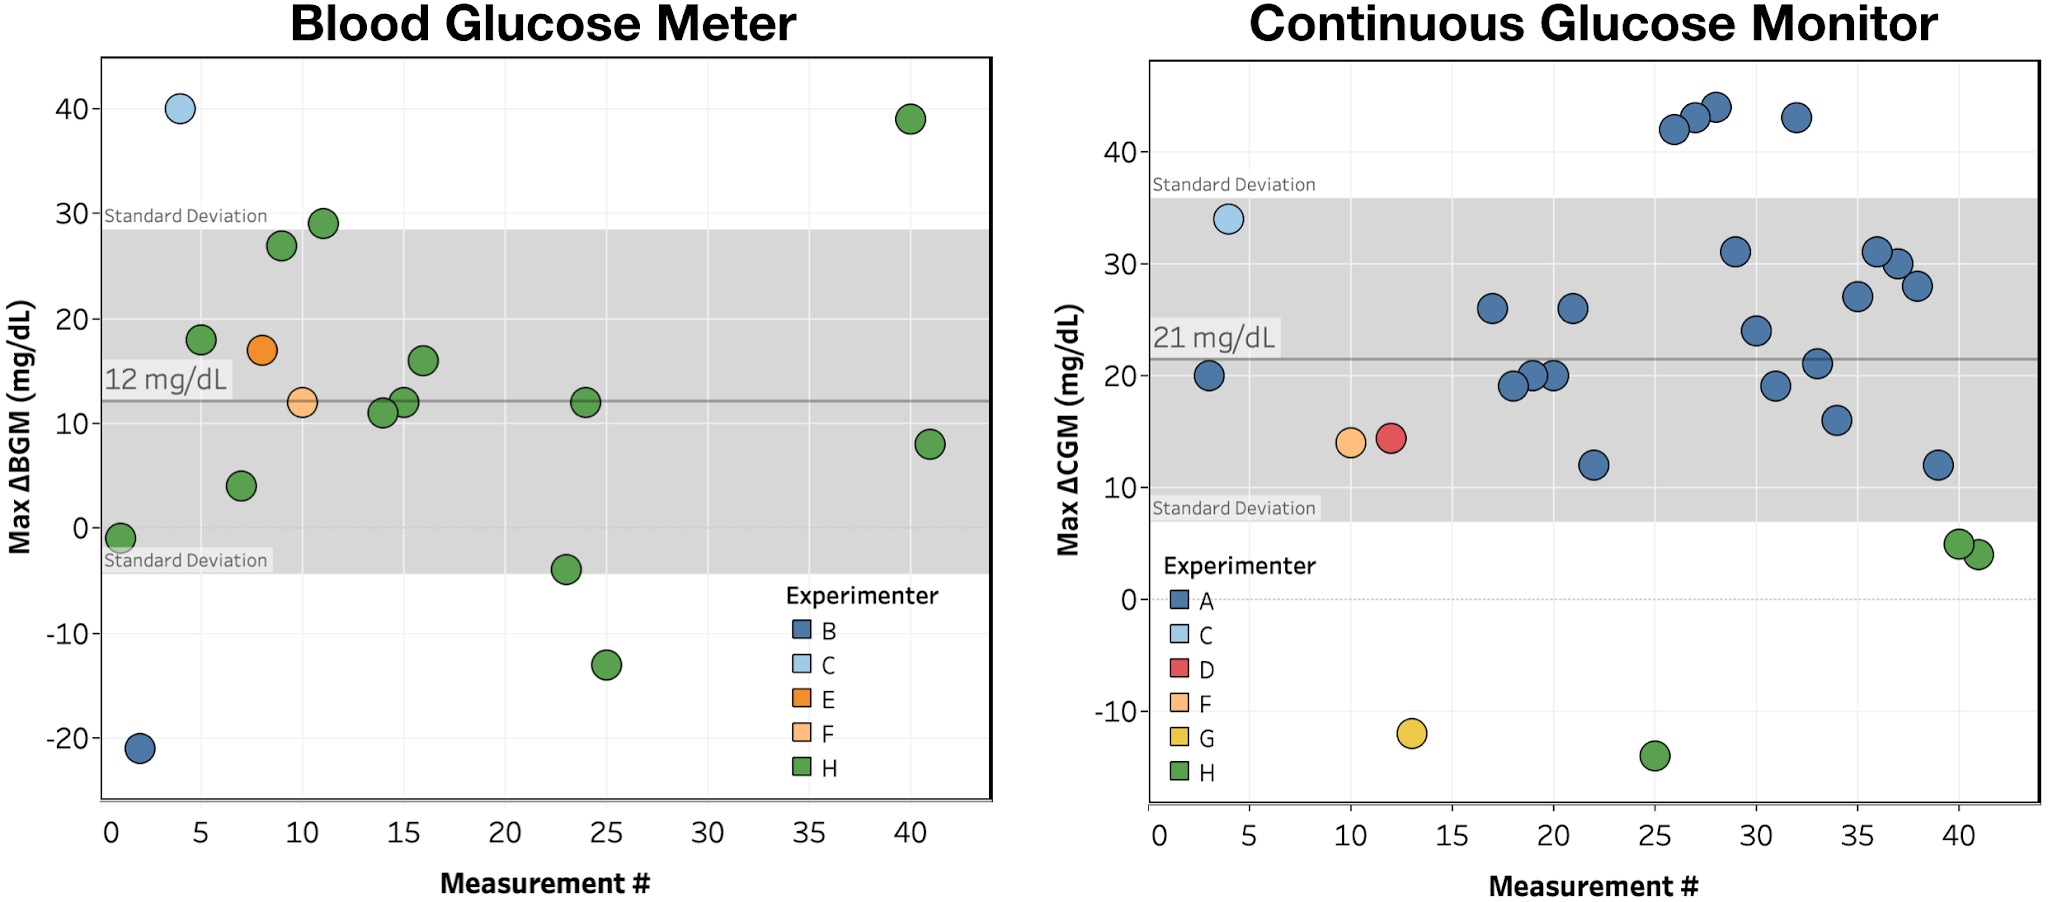
Looking at the data in Figure 1:

  • There is a large rise in blood glucose following a hot shower, though with significant variance in the size of the effect.  
  • The rise is observed for both BGM (12 ± 17 mg/dL) and CGM (21 ± 15 mg/dL) measurements.
  • By count, we see (1 measurement excluded due to recording error):
    • >5 mg/dL increase: 34/40 (85%)
    • >5 mg/dL decrease: 3/40 (7.5%)
    • <5 mg/dL change: 3/40 (7.5%)

Conclusion: Blood glucose showed a consistent, measurable increase within 1h of taking a hot shower.


Is the observed change in blood glucose real or a CGM sensor artifact?

Looking again at Figure 1, the increase in blood glucose is seen for both BGM and CGM measurements, indicating that it can’t be just a CGM artifact. 

To further confirm this conclusion, we looked at the data from person H comparing BGM vs. CGM measurements during the normal course of the day vs. after a shower. As shown in Figure 2, for a single Libre sensor, there is a linear relationship between measured blood glucose by BGM vs. CGM and the data collected immediately and 15 minutes after a shower mostly lies within the normal variance in the data, with all exceptions showing a lower blood glucose measured by CGM. This indicates that any variation in CGM data due to a sensor artifact is smaller than the observed increase in blood glucose. Note that while this confirms that the measured effect is not exclusively due to a sensor artifact, it is still possible that a sensor artifact accounts for the difference in effect size as measured by BGM vs. CGM (12 vs. 21 mg/dL).

Figure 2. Blood glucose measured by FreeStyle Libre and FreeStyle Freedom Lite for person H over the course of 10 days. Grey line is a linear fit to the data and data collected immediately and 15 min. after a hot shower is shown in red.

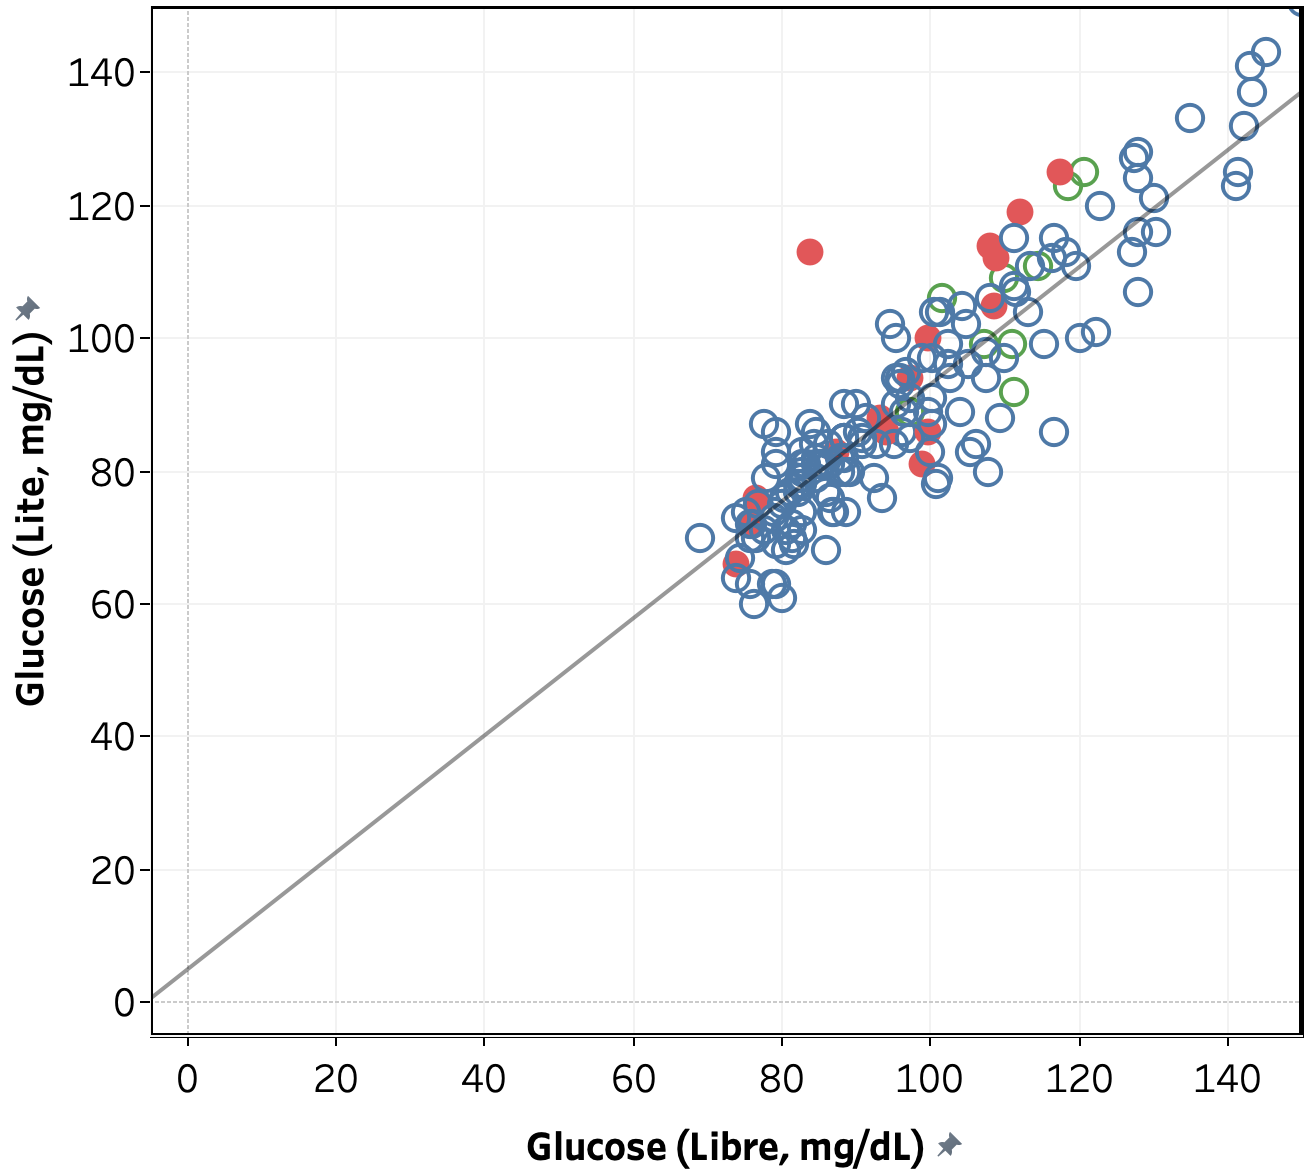
Conclusion: The observed increase in blood glucose is not a CGM sensor artifact (though a partial effect from the CGM sensor is not ruled out).


Is there significant person-to-person variation in the magnitude or direction of the effect?

Looking again at the data in Figure 1:

  • A >5 mg/dL increase in blood sugar is observed for 6/8 (75%) of participants, with 2/8 (25%) showing a >5 mg/dL decrease in blood sugar.
  • Only 2 participants provided multiple measurements, A and H. For those we observe:
    • A: 12 ± 16 mg/dL
    • H: 26 ± 14 mg/dL
    • The difference is statistically significant (Welch’s t-test, p=0.016), but since the measurements were made using different methods (CGM for A, BGM for H), times (10 min. for A, 20 min. for H), and temperatures, this is only weak evidence for person-to-person variation.

Conclusion: The data is consistent with person-to-person variation, but significantly more data and/or more controlled conditions are required to determine if the variation exists and it’s effect size.


Is the change in blood glucose cause by the hot shower?

This is the most difficult question to answer. In hindsight, we should have done some randomized experiments where the experimenters held conditions as constant as possible, randomly decided whether or not to shower, and measured blood glucose either way. In the absence of that data, we analyzed the data we had for any correlation between the blood glucose rise and non-shower factors. It should be noted that the protocol did not control for any of these factors, so no causation or lack thereof should be inferred from the analysis.

  • Max ΔBGM or Max ΔCGM vs. hour of the day – no trend across the whole data set, nor within experimenters
  • Max ΔBGM vs. starting BGM – no trend across the whole data set, but within Experimenter H’s data, there’s an indication of a negative correlation (R2 = 0.32, p = 0.045).
  • Max ΔCGM vs. starting CGM – no clear trend across the whole data set, nor within experimenters.
  • Max ΔBGM vs. Temperature – no clear trend across the whole data set, nor within experimenters. Note: most experimenters did not record the shower temperature and the one who did (Person H) kept the temperature within ±3 °C.
  • Max ΔBGM or Max ΔCGM vs. Time since last meal or medication – There’s a positive correlation over the whole data set, but it doesn’t hold up within the two experimenters with repeat measurements, suggesting that it’s an effect  person-to-person variation, possibly caused by systematic variation in conditions.


Conclusion: We can not identify any factors that account for the blood glucose rise other than the shower, but would need significantly more data and/or more controlled conditions to be certain that the shower is the cause.


Conclusions & Lessons Learned

By working together, the team of experimenters was able to learn more and learn faster than any one of us would have been able to on our own. From the data, we were able to answer several of our initial questions.

Conclusions:

  1. What is the change in blood glucose after a hot shower under controlled conditions?
    • From BGM: 12 ± 17 mg/dL
    • From CGM: 21 ± 15 mg/dL
  2. Is the observed change in blood glucose real or a CGM sensor artifact?
    • The change is real, not a sensor artifact (change is observed with BGM; CGM measurements are consistent with typical variation between CGM and BGM)
    • We cannot rule out the difference in effect size between BGM and CGM being due to a sensor artifact, but the data does not provide support for this hypothesis.
  3. Is there significant person-to-person variation in the magnitude or direction of the effect?
    • The data is consistent with person-to-person variation, but significantly more data and/or more controlled conditions are required to determine if the variation exists and it’s effect size.
  4. Is the change in blood glucose cause by the hot shower?
    • We can not identify any factors that account for the blood glucose rise other than the shower, but would need significantly more data and/or more controlled conditions to be certain that the shower is the cause.

While we were not able to get firm answers to all of our questions, we did get a measure of the effect size and rule out it being a CGM sensor artifact (the leading hypothesis in the original post). We also learned a lot that will help guide future Community Self-Experiments.

Key Lessons Learned:

  • Community Self-Experiments enable collection of data much faster than single-person experiments, both because more people are collecting data and because the group activity motivates participants.
  • Take more care with the experimental design, especially the implementation of control experiments to help rule out alternate hypotheses.
  • Implement better data sharing/management. In this experiment, data was posted, then manually entered into an excel sheet, which was very time consuming.

Get new posts by email or rss feed

Effect of Food Ingredients on Blood Glucose: Allulose

Get new posts by email or rss feed


This self-experiment is being done as part of the Keating Memorial Self-Research Project. A couple of other people from the Open Humans community are also running the same experiments. If you’re interested in joining in, let me know in the comments or send me a PM. 

This post is an update on my experiments measuring the effect of food ingredients on blood sugar.

Plan:

  • Design experiments and solicit feedback: blogRedditOpenHumans
  • Calibrate continuous blood glucose meter: started 2/18, report tbd.
  • Establish fasting baseline & determine time of day for experiments: Complete
  • Food effect measurements
    • Glucose: Complete
    • Allulose: Complete (this post)
    • Oat fiber: started 3/13
    • Whey protein
    • Oat fiber, cooked
    • Resistant starch
    • Tapioca fiber
    • Lupin flour

This week, I have the results from allulose and got started on oat fiber.


Summary

Allulose has a negligible effect on my blood sugar, <0.1 mg/dL/g(allulose), or <2% that of glucose.


Details

Purpose

To quantify the effect of ingestion of food ingredients and ingredient combinations on my blood sugar.


Ingredient Background

Allulose is a sugar substitute with very similar physical properties to table sugar. This makes it particularly useful in low carb baking or any recipe where sugar provides texture as well as taste. I personally have found it particularly useful for making ice cream, cookies, and syrup.


Design/Methods

Procedure. From 7 pm the day before through 4:30p the day of experiment, no food or calorie-containing drinks were consumed and no exercise was performed. Non-calorie-containing drinks were consumed as desired (water, caffeine-free tea, and decaffeinated coffee). At ~12 pm, the substance to be tested was dissolved or suspended in 475 mL of water and ingested as rapidly as comfortable. BGM measurements were then taken approximately every 15 min. for 2 h or until blood glucose had returned to baseline, whichever was longer. A final BGM measurement was taken 4.5 h after ingestion.

Measurements. Blood glucose was measured using a FreeStyle Libre flash glucose monitor and a FreeStyle Freedom Lite glucose meter with FreeStyle lancets & test strips. No special precautions were taken to clean the lancing site before measurement. To take a sample, the lancing devices was used to pierce the skin at an ~45 deg. angle from the finger. Blood was then squeezed out by running the thumb and pointer finger of the opposite hand from the first knuckle to the lancing site of the finger. Blood was then wicked into a test strip that had been inserted into the meter and the glucose reading was recorded.

Data Processing & Visualization. iAUC was calculated using the trapezoid method (see data spreadsheet for details). Data was visualized using Tableau.

Medication. I took my normal morning and evening medication, but did not dose for the experimental food ingested.


Data

Link


Results & Discussion

Figure 1.  Change in blood glucose vs. time for alluose tests.

Change in blood glucose as a function of time for the allulose tests is shown in Figure 1. Qualitatively, there appears to be no impact of allulose up to 60 g consumed, with the possible exception of a small around 75 min.

Figure 2. Maximum blood glucose increase and iAUC vs. amount consumed. Red and blue indicate glucose and allulose, respectively. The line is the best linear fit to the data.

To better quantify the impact of glucose on my blood glucose, I plotted the maximum increase in blood glucose and the iAUC of blood glucose (incremental area under the curve) vs. amount consumed for both glucose and allulose (see Figure 2). While the allulose data shows an increase in both blood glucose and iAUC as a function of amount consumed, there’s only two data points and the magnitude is extremely small and could easily be due to experimental error. Confirming this effect would require running more allulose measurements. I may go back and do this later, but for the moment, I would prefer to focus my time on ingredients with unknown or more substantial effects.

Lastly, I continue to observe a large negative intercept, suggesting a background drop in blood sugar during the experimental window. 


Conclusion & Next Experiments

Allulose has a negligible effect on my blood sugar, <0.1 mg/dL/g(allulose), or <2% that of glucose. This week, I will measure the effect of oat fiber, a zero calorie, zero digestible carbohydrate flour replacement.


– QD


Get new posts by email or rss feed

Recipe: Black Soybean & Lupin Flour Fritters with Yogurt Dip, 1 g Net Carbs per Fritter

Get new posts by email or rss feed


Black Soybean & Lupin Flour Fritters with Yogurt Dip

I adapted this recipe from Gordon Ramsay’s Ultimate Cookery Course (book, video). To make it low-carb, more convenient, and improve the taste, I made the following modifications:

  • Substituted lupin flour for all-purpose flour
  • Substituted black soybeans for corn
  • Substituted almond milk for milk and increased quantity to compensate for greater water absorption of the lupin flour
  • Added garlic powder
  • Replaced fresh herbs and spices with dried
  • Increased amount of chile

I’m really happy with how this came out. The fritters are crunchy on the outside and soft/creamy on the inside and the black soybeans provide a nice texture and flavor contrast. The yogurt sauce is great as well, giving an extra spicy “kick”. 

The recipe is also quite customizable. You can modify the seasonings and fillings to whatever you like. In the future, I plan to try combining the black soybeans with baby corn and/or okra to get a more complex set of flavors.

Note: In case there’s a concern about the blood sugar impact of the Lupin flour, from testing my blood sugar, I only need an extra 0.5u of insulin when I eat this compared with my normal dinner (300g meat, 150g low-carb vegetable).


Hope you enjoy it!

– QD


Black Soybean and Lupin Flour Fritters

QD
Black Soybean and Lupin Flour Fritters
Prep Time 10 minutes
Cook Time 6 minutes
Total Time 16 minutes
Servings 9 fritters
Calories 66 kcal

Ingredients
  

Fritters

  • 100 g lupin flour
  • ½ tsp baking powder
  • ½ tsp chili powder (or 1 fresh chili)
  • 2 tsp ground coriander (or 2 tbsp fresh, chopped)
  • salt & pepper, to taste
  • 1 egg
  • 160 g almond milk
  • 15 g olive oil
  • 2 spring onions, finely sliced
  • 250 g black soybeans

Yogurt Sauce

  • 250 g plain yogurt (I use Two Good brand)
  • 1 tsp chili powder (or 2 fresh chilis)
  • 30 g lemon juice
  • 1 tbsp ground coriander (or 3 tbsp. fresh, chopped)

Instructions
 

Fritters

  • Whisk together lupin flour, baking powder, chile powder, coriander, salt, and pepper.
  • Add the egg and almond milk and mix until smooth. Add olive oil and mix again until homogeneous.
  • Add black soybeans and spring onions into the batter and mix until combined.
  • Pan fry in olive oil over medium heat until golden brown, ~3 minutes per side.
  • Serve warm with yogurt dip.

Yogurt Dip

  • Mix together all ingredients, tasting and seasoning as necessary.

Notes

0.8g net carbs per fritter.
Yogurt dip is 133 cal, 3.3 fat, 5 g carb, 20 g protein for the whole recipe. Amount per fritter depends on how much you use.
Nutrition information calculated by adding up macros of the individual ingredients.

Nutrition

Serving: 1fritterCalories: 66kcalCarbohydrates: 6.5gProtein: 7.7gFat: 2.8gFiber: 5.8g
Tried this recipe?Let us know how it was in the comments

Get new posts by email or rss feed

Effect of Food Ingredients on Blood Glucose: Dissolved Glucose

Get new posts by email or rss feed


This self-experiment is being done as part of the Keating Memorial Self-Research Project. A couple of other people from the Open Humans community are also running the same experiments. If you’re interested in joining in, let me know in the comments or send me a PM. 

This post is an update on my experiments measuring the effect of food ingredients on blood sugar.

Plan:

  • Design experiments and solicit feedback: blogRedditOpenHumans
  • Calibrate continuous blood glucose meter: started 2/18, report tbd. (probably 3/16)
  • Establish fasting baseline & determine time of day for experiments: Complete
  • Food effect measurements
    • Dissolved glucose: Complete (this post)
    • Allulose: starting 3/9 

The analysis & calibration of the data from my CGM is more complicated than I expected, though extremely interesting. It’s going to take me another week or two to get it written up. In the meantime, I have the results from the first ingredient, dissolved glucose.

Summary

  • Dissolved glucose raises my blood sugar by 6.7 mg/dL/gglucose, with the peak occurring from 45-75 min. after ingestion. 
  • Results are extremely linear with amount consumed, with a slightly better fit when using incremental area under the curve (iAUC) vs. the peak increase (R2 = 0.988 vs. 0.983).

Details

Purpose

To quantify the effect of ingestion of dissolved glucose on my blood sugar.


Design/Methods

Procedure. From 7 pm the day before through 4:30p the day of experiment, no food or calorie-containing drinks were consumed and no exercise was performed. Non-calorie-containing drinks were consumed as desired (water, caffeine-free tea, and decaffeinated coffee). At ~12 pm, glucose was dissolved in 475 mL of water and ingested as rapidly as comfortable. BGM measurements were then taken approximately every 15 min. for 2 h or until blood glucose had returned to baseline, whichever was longer.

Measurements. Blood glucose was measured using a FreeStyle Libre flash glucose monitor and a FreeStyle Freedom Lite glucose meter with FreeStyle lancets & test strips. No special precautions were taken to clean the lancing site before measurement. To take a sample, the lancing devices was used to pierce the skin at an ~45 deg. angle from the finger. Blood was then squeezed out by running the thumb and pointer finger of the opposite hand from the first knuckle to the lancing site of the finger. Blood was then wicked into a test strip that had been inserted into the meter and the glucose reading was recorded.

Data Processing & Visualization. iAUC was calculated using the trapezoid method (see data spreadsheet for details). Data was visualized using Tableau.

Medication. I took my normal morning and evening medication, but did not dose for the glucose.


Data

Link


Results & Discussion

Figure 1.  Change in blood glucose vs. time.

Change in blood glucose as a function of time is shown in Figure 1. Qualitatively, upon ingestion I observe an increase in blood glucose, with the magnitude and time to peak increasing with increasing amount of glucose. In all cases, my blood glucose returned to baseline within 135 min.

Figure 2. Maximum blood glucose increase and iAUC vs. glucose consumed. The line is the best linear fit to the data.

To better quantify the impact of glucose on my blood glucose, I plotted the maximum increase in blood glucose and the iAUC of blood glucose (incremental area under the curve) vs. glucose consumed. As shown in Figure 2, both measures were extremely linear vs. amount consumed, with a slightly better fit when using incremental area under the curve (iAUC) (R2 = 0.988 vs. 0.983). However, in both cases there was a large negative intercept, suggesting either a background drop in blood sugar or a non-linear effect that would show up with a wider range of amounts.


Conclusion & Next Experiments

Based on the both the repeatability and linearity of the data, my experimental protocol appears to be working well. This week, I will try the first of the low-carb ingredients, Allulose. 


– QD


Get new posts by email or rss feed

Recipe: 1.6g Net Carb French Toast

Get new posts by email or rss feed


1.6g Net Carb French Toast

u/Trap-Lord on Reddit recommended Chompie’s low-carb bread, so I got some from Amazon to try. It’s crazy expensive ($14/loaf), but extremely good. Taste and texture are close to regular bread (slightly more sour, slightly more spongy), but it toasts almost perfectly. 

I’ve been experimenting with different ways of using it and wanted to share the results. After just making plain toast, my first attempt was French Toast. This used to be one of my favorite breakfasts. I haven’t been able to have this since going low carb 9 years ago, so I was excited to try it out.

It turnout out really good, crispy on the outside, creamy in the middle, taste similar to how I remember. The only thing I didn’t love was the syrup. I used Pyure brand. It was ok, but too thin and not strong enough maple flavor.  

Does anyone have a recommendation for a good low-carb maple syrup? If so, please let me know in the comments.


Hope you enjoy it!

– QD


1.6g Net Carb French Toast

QD
1.6g Net Carb French Toast
Prep Time 2 minutes
Cook Time 6 minutes
Total Time 8 minutes
Servings 2 slices
Calories 188 kcal

Ingredients
  

Instructions
 

  • Melt butter in a frying pan over medium heat.
  • Whisk together egg, almond milk, and vanilla.
  • Soak bread in egg mixture, then cook until golden brown on both sides (~3 min. per side).
  • Serve, topping with sweetener of choice.

Notes

1.6 net carbs per serving.
Nutrition information calculated by adding up macros of the individual ingredients. Allulose not included in the Total or Net carbs.

Nutrition

Serving: 1sliceCalories: 188kcalCarbohydrates: 3.6gProtein: 10.1gFat: 13gFiber: 2g
Tried this recipe?Let us know how it was in the comments

Get new posts by email or rss feed