My Routine: Diet, Medication, & Excercise

Last updated 1/21/20

Since most of my experiments will be about the effect of modifying my diet, medication, or exercise, I thought it’d be useful to document my baseline routine.

  • Diet:
    • Strategy: 
      • Ultra low-carb (<15 g/day) for easier glucose management
      • High protein (120 g/day, 1.6 g/kg bodyweight)
      • Same meal every day for breakfast and lunch (makes medication tuning easier)
      • Consistent meat and vegetable quantities for dinner (couldn’t tolerate 3 identical meals/day, too boring) 
    • Breakfast:
      • 1 serving Ketochow with 2 tbsp. butter.
      • 3 oat-fiber protein muffins
      • 406 calories, 44 g protein, 5.7 g net carb.
    • Lunch:
      • 1 serving Ketochow with 2 tbsp. butter.
      • 3 oat-fiber protein muffins
      • 406 calories, 44 g protein, 5.7 g net carb.
    • Dinner:
      • 300 g meat
      • 150 g low-carb vegetable (spinach, okra, broccoli, cauliflower, green beans)
      • Note: this is the meal I “cheat” on most often. I have a few favorite recipes for which I’ve calibrated insulin doses and will go out to eat once in a while. 
    • Snacks: 
      • I try to limit this as much as possible (1-2 times/wk) and to offset with additional exercise.  
      • Homemade low-carb ice-cream, cookies, biscuits, etc.
      • Pork rinds
      • High cocoa chocolate (≥85%)
  • Medication:
    • Strategy:
      • Keep blood sugar as steady as possible (80-90 mg/dL) with a combination of fast- and regular-acting insulin plus a small amount of slow-acting basal insulin to reduce strain on my remaining beta cells.
      • Oral:
        • Metformin (Glucophage brand), extended release, 2×1000 mg (upon waking up and before bed)
      • Insulin:
        • All dilutions are 3:1 (25% insulin)
        • Waking up: 0.5 units Tresiba (slow-acting), 1.5 units diluted Novolog (fast-acting, to off-set the dawn phenomenon)
        • Breakfast: 7 units diluted Novolog
        • Lunch: 4 units diluted Novolog
        • Dinner: 8 units diluted Humalog
        • Before bed: 0.5 units Tresiba (long-acting)
        • Adjustments: 0.5 unit diluted Humalog for each additional gram of carbohydrate or 28 grams of protein above my normal meal.
  • Exercise:
    • Total time:
      • 7 h/wk, but the martial-arts classes are fun.
    • Strength-training: 
      • 2 days/wk, 30 min. bodyweight upper-body and core
      • 2 days/wk, 30 min. dumbbell upper-body and core
      • 4 days/wk 15 min. stationary bike set at high resistance
    • Cardio:
      • 2 days/wk, 1 h mixed-martial arts (high intensity)
      • 2 days/wk, 1 h kung-fu (low intensity)
      • 4 days/wk 15 min. stationary bike set at high resistance (same as under strength-training)


– QD


Get new posts by email or rss feed

Experiment #1: Measurement Reproducibility

If I’m going to study how external stimuli affect blood glucose, the main measurement device I’ll be using will be a glucose meter (the one I have is the FreeStyle Freedom Lite). In order to understand the measurements I make, I’m going to need to know the accuracy and the precision of the device. By law, home blood glucose meters must give results that are within 20% of laboratory tests 95% of the time. That would mean that if someone’s blood glucose was 100 mg/dL, the meter could report 80-120 mg/dL. If that’s the kind of precision I’ll be getting, then I should just give up now. Fortunately, they’re a lot better than that. 

Although there are a ton of studies on the accuracy and precision of blood glucose meters, I wanted to assess my specific meter under the conditions that I will be using it. To assess the accuracy, I measured the FreeStyle Control solution. To assess the precision, I measured my own blood glucose in sets of 5 measurements at different times over the course of the week (so that I’d have different glucose numbers).


Purpose

To evaluate the reproducibility of the FreeStyle Freedom Lite glucose meter under the conditions that will be used for subsequent experiments.


Design/Methods

General. All measurements were done using a FreeStyle Freedom Lite glucose meter and FreeStyle lancets & test strips. To reflect my normal usage, no special precautions were taken to clean the lancing site before measurement. To take a sample, the lancing devices was used to pierce the skin at an ~45 deg. angle from the finger. Blood was then squeezed out by running the thumb and pointer finger of the opposite hand from the first knuckle to the lancing site of the finger. Blood was then wicked into a test strip that had been inserted into the meter and the glucose reading was recorded.

Control solution test. FreeStyle control solution was purchased from Abbot on Amazon. Drops of solution were removed from the bottle according to the manufacturers instructions and tested using the procedure described above.

Blood tests. Sets of 5 blood samples were measured according to the procedure described above. The sample set was taken from either 5 locations on the same finger or the same location on 5 separate fingers over the course of ~1 min. Times were chosen to obtain a range of blood glucose values. 


Data


Results & Discussion

Control Solution Tests. Unfortunately, commercial control solutions do not specify the exact glucose concentration, but instead only give a range of acceptable values that fall within the FDA’s +/-20% accuracy requirement (link, link). The Freestyle control solution kit I purchased came with two solutions, “High” and “Low”. My vial of test strips specifies the acceptable ranges of these solutions as 248-372 and 30-60 mg/dL, respectively. Assuming the ranges are centered on the actual value, that gives actual values of 310 mg/dL for “High” and 45 mg/dL for “Low.” I took 8 measurements of each control solution. 

Figure 1. Measured glucose concentration vs. sample # for “Low” control solution. The reference line indicates the expected reading based on the average of the manufacturer’s acceptable range.
Figure 2. Measured glucose concentration vs. sample # for “High” control solution. The reference line indicates the expected reading based on the average of the manufacturer’s acceptable range.
Table 1. Table of results of glucose measurements of control solution.

Happily, the readings were reasonably close to the expected value: 2 mg/dL (3%) for the “low” solution and 19 mg/dL (6%) for the “high”. The standard deviation and 95% confidence interval were more consistent between the two solutions at 3-4 & 6-7 mg/dL, respectively. As such, if a measurement were run repeatedly, I can expect it to fall between +/- 7 of the observed value 19 out of 20 times. 

Blood tests. Next up was testing the accuracy of actual blood measurements. Shown below are the results of 11 sets of 5 measurements each taken over 7 days at different times of the day. 

Figure 2. Standard deviation vs. average glucose for blood measurements. The grey line and R^2 value are for a linear fit to the data.
Table 2. Table of results of blood glucose reproducibility measurements. 

Surprisingly, the precision of the blood glucose measurements was just as good as those of the control solutions. Looking at Figure 2, there’s only a weak correlation between standard deviation and average glucose for a set of measurements (R^2 = 0.21). Given that, I was able to calculate a standard deviation for the whole data set (i.e. pooled standard deviation) of 3.0 mg/dL (95% CI = 6.0 mg/dL), nearly identical to that of the control measurements. This suggests that the variation in the measurements is coming from something in the meter, test strips, or external environment, rather than something in the blood. 


Conclusions

A standard deviation of only 3 mg/dL blood glucose measurements should be good enough to measure the effect of different foods and other external stimuli or interventions. While there is a small correlation between the standard deviation and average glucose, it’s weak enough that 1) it may not be real and 2) I can ignore it for now.


Next Experiments

I’m always interested in ideas for new experiments, so please leave a comment if there’s something you’d like me to try.

  • I will continue to measure the precision of the meter on a less frequent basis (sets of 5 measurements). Purpose is to:
    • Get a better a more accurate measure of the correlation between standard deviation and average glucose
    • See if there’s any trend in standard deviation with time, time of day, same vs. different fingers, etc.
  • To ensure I’m not biasing the sample set by only taking measurements when I’m interested in the reading, I will randomize when I do a reproducibility measurement by rolling two ten-sided dieand taking a set of 5 measurements when the number is ≤ 2 (~2/week).
  • For next week, I’ll start measuring how my blood glucose is affected by food and exercise.
    • Getting a clean measurement for these is going to be tricky, as at any given time, there are a large number of factors affecting my blood glucose.
    • To deal with this, I will pick standard times of day where external factors are as consistent as possible and then flip a coin to randomly decide whether to eat or exercise a fixed amount and then measure my blood sugar over time.
    • It may take a while to get enough data to get reasonable statistics. If I don’t have enough data by next week, I’ll  post an exploratory analysis of the initial data.


– QD

P.S. I’m sorry for the less than ideal graph/table arrangement on this post. I’m still getting a hang of blogger and I can’t figure out how to get two pictures to display next to one another.


Get new posts by email or rss feed

And so it begins…

Hello world,

I’m 38 years old, I have Type 2 diabetes, and I’m going to try to figure out how it works and better ways of managing it through self-tracking, experimentation, and (hopefully) collaborating with
others doing the same thing.

At the age of 29, I started having the following symptoms:

  1. Insomnia – I started sleeping <4 hours per night, but wasn’t tired during the day
  2. Weight loss – went from 210 to ~190 lbs. in 1 month without changing my diet
  3. Thirst – started drinking a ton of water. By the end, ~1 cup every 0.5 h
  4. Frequent urination – presumably caused by #3
  5. Blurred vision – had to sit much closer to the screen at a seminar I attended

I went to the doctor and was quickly diagnosed with Type 2 diabetes. My HbA1c was 8.7%, which means that my blood glucose was averaging >232 mg/dL. People without diabetes will have an H1Ac of <5.7 (average glucose <120 mg/dL). 

I went home and read everything I could find on diabetes symptoms, progression, and treatment. I found out that since most people get diabetes after age 50, there’s almost no data on long term survival
rates or even disease progression for people my age. 

Not wanting to die, go blind, lose my feet, or even have to start injecting with insulin, I decided to treat my diabetes aggressively, with a goal of keeping my blood sugar the same as that of a non-diabetic. I
went on Metformin, started obsessively testing my blood glucose, radically cut down on the amount of
carbohydrates I ate (down to <20 g per meal), and cut calories until I hit 165 lbs. (BMI = 23.5).

With all that, I was able to get my blood sugarunder control. Here’s my HbA1c history for the first two years:

  • 3/2011 – 8.7%
  • 6/2011 – 6.0%
  • 3/2012 – 5.3%
  • 8/2012 – 5.3%

So, I got my blood sugar into the “normal” range, but at the cost of having to think about/worry about
food constantly. It was worth it, but very unpleasant.

I was able to maintain this approach for 4 years, but in late 2016 I got pneumonia. My blood sugar was high while I was sick (~160 mg/dL), which wasn’t a big deal, but when I recovered it didn’t come
down. With the same diet as before, I routinely had a fasting blood sugar of >120 mg/dL and 2h post-meal level of >160 mg/dL.

After struggling to try to get things back under control with diet and exercise, I went to a series of doctors and eventually ended up going on insulin. This helped, but I was still seeing blood sugar higher than “normal” and since I my blood sugar was “under control” by the standard of care, the doctors I was seeing didn’t want to prescribe any further treatment.

As when I was diagnosed, I did my own search and ended up finding a book by Dr. Richard
Bernstein
that advocated a more aggressive treatment approach involving a strict and consistent low-carb diet and careful, but aggressive use of insulin to keep blood sugar in the range normal for a non-diabetic. I became a patient of Dr. Bernstein’s and by following his approach was finally able to get my blood sugar back under control to my standards.

Here’s my HbA1c history during this time:

  • 11/2016 – 6.7% (after recovery from pneumonia)
  • 12/2016 – 6.3%
  • 2/2017 – 6.0%
  • 3/2017 – 6.4%
  • 9/2017 – Started working with Dr. Bernstein.
  • 9/2019 – 5.1% (most recent)

This new approach works, but at the cost of an extremely regimented diet, exercise, and lifestyle. It also frequently falls apart when I have to travel or eat out for work. Lastly, I’m only 38 and I’m worried about how much more difficult this will get if my diabetes progresses any further.  

A few months ago, I started reading about the Quantified Self movement, people who track information about themselves to better understand and improve their mental or physical well-being. I was particularly inspired by the people who used self-tracking to understand and control diabetes (linklinklink). Thinking about it, I realized that while I had my blood sugar under control, I didn’t really understand what influenced my glucose level beyond the simplisitic “more carbs or protein –> higher glucose” and “fiber and sugar alcohols >> sugar and starches”.  There’s a lot of “common wisdom,” as well as peer reviewed research on the topic, but much of it is contradictory, doesn’t apply to people who already have reasonable glucose control, and/or doesn’t provide clear, actionable, conclusions.

So, I’ve decided to start experimenting on myself to try to better understand diabetes and how to manage it. In particular, I’d like to understand how different external stimuli (food, sleep, exercise, etc.) affect blood sugar levels. My goal is more than just optimization of my own diabetes management, I’d like to try to understand better how diabetes works and hopefully come up with better ways of managing it for everyone. Doing that will require getting others involved to pool data and brainpower. 

That’s where this blog comes in. I’m going to post all my experiments here with detailed protocols, results, and analysis. The hope being that others will read it and be able to conduct their own experiments and analysis. If I’m really lucky, maybe we can create a community of diabetes self-trackers that can work together to better understand the disease. 

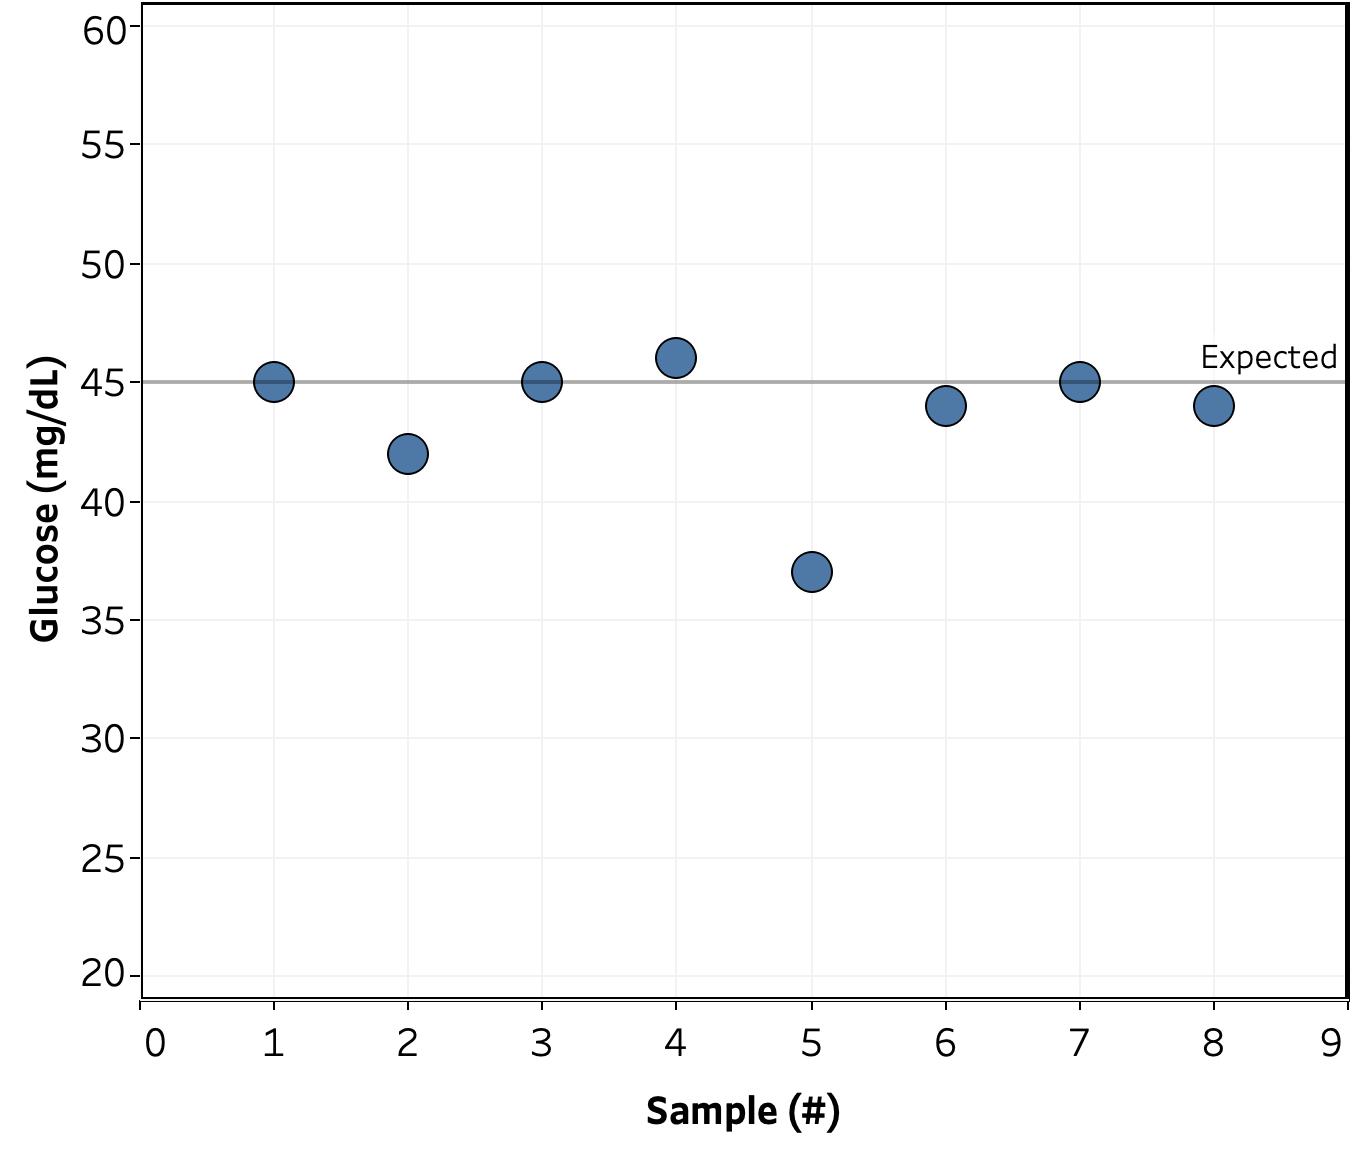
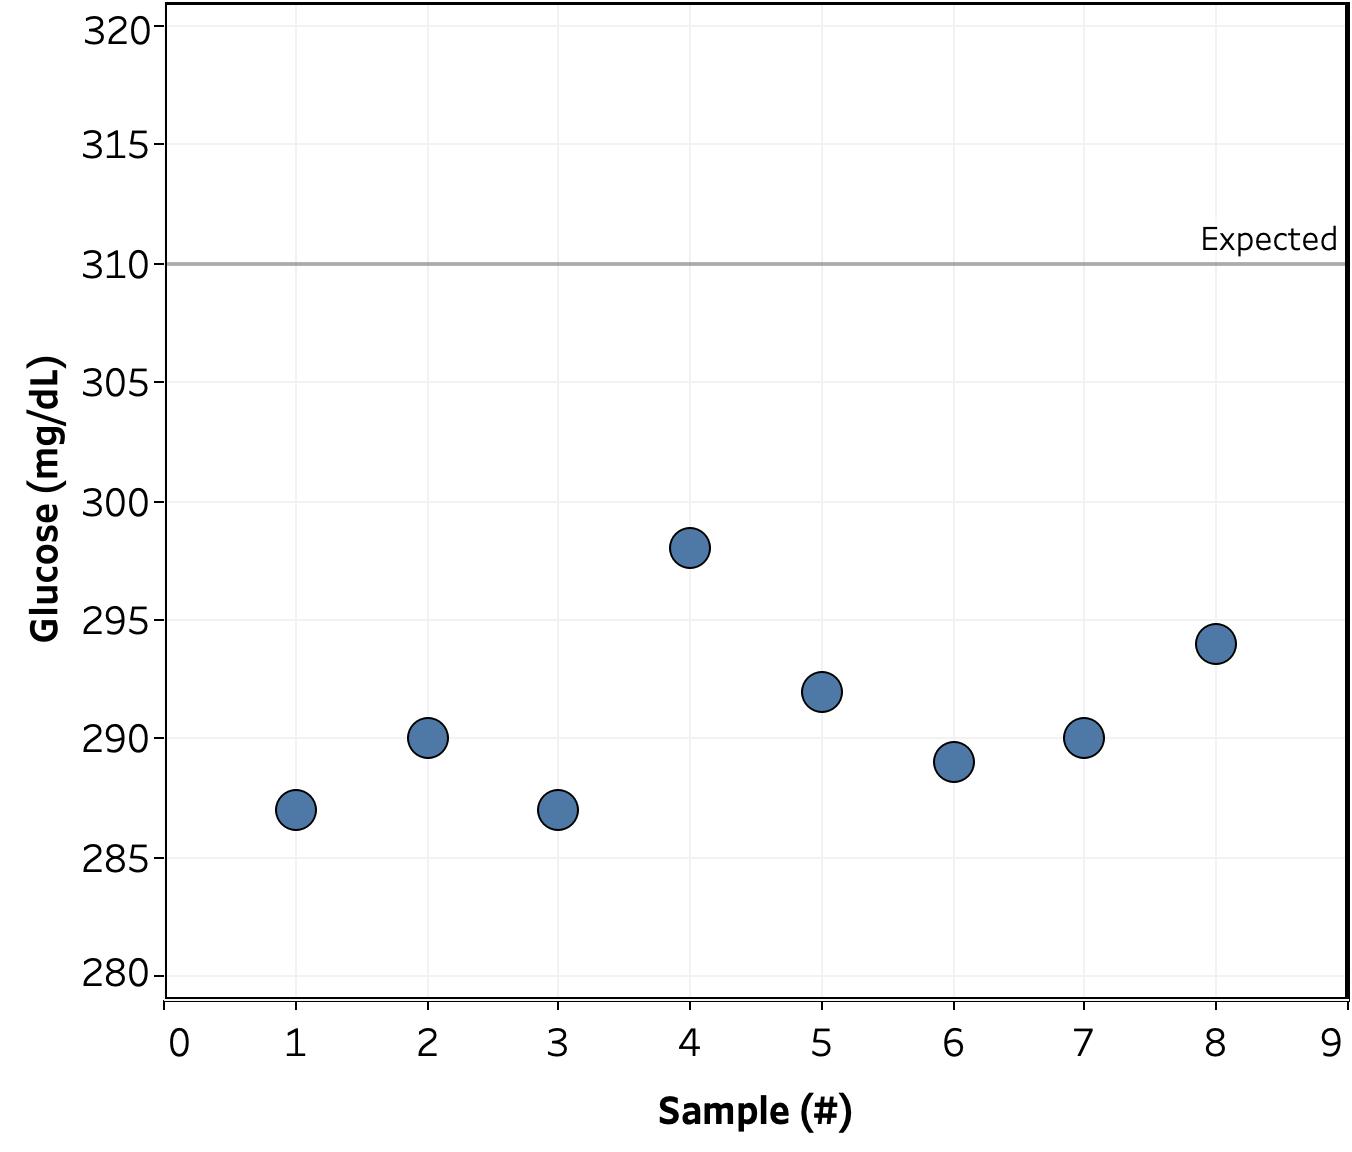
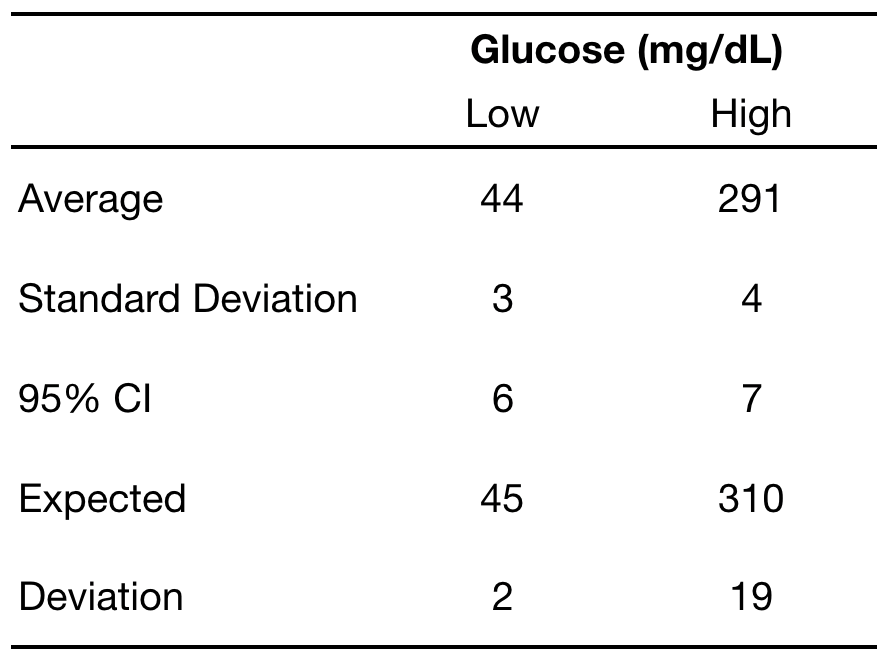
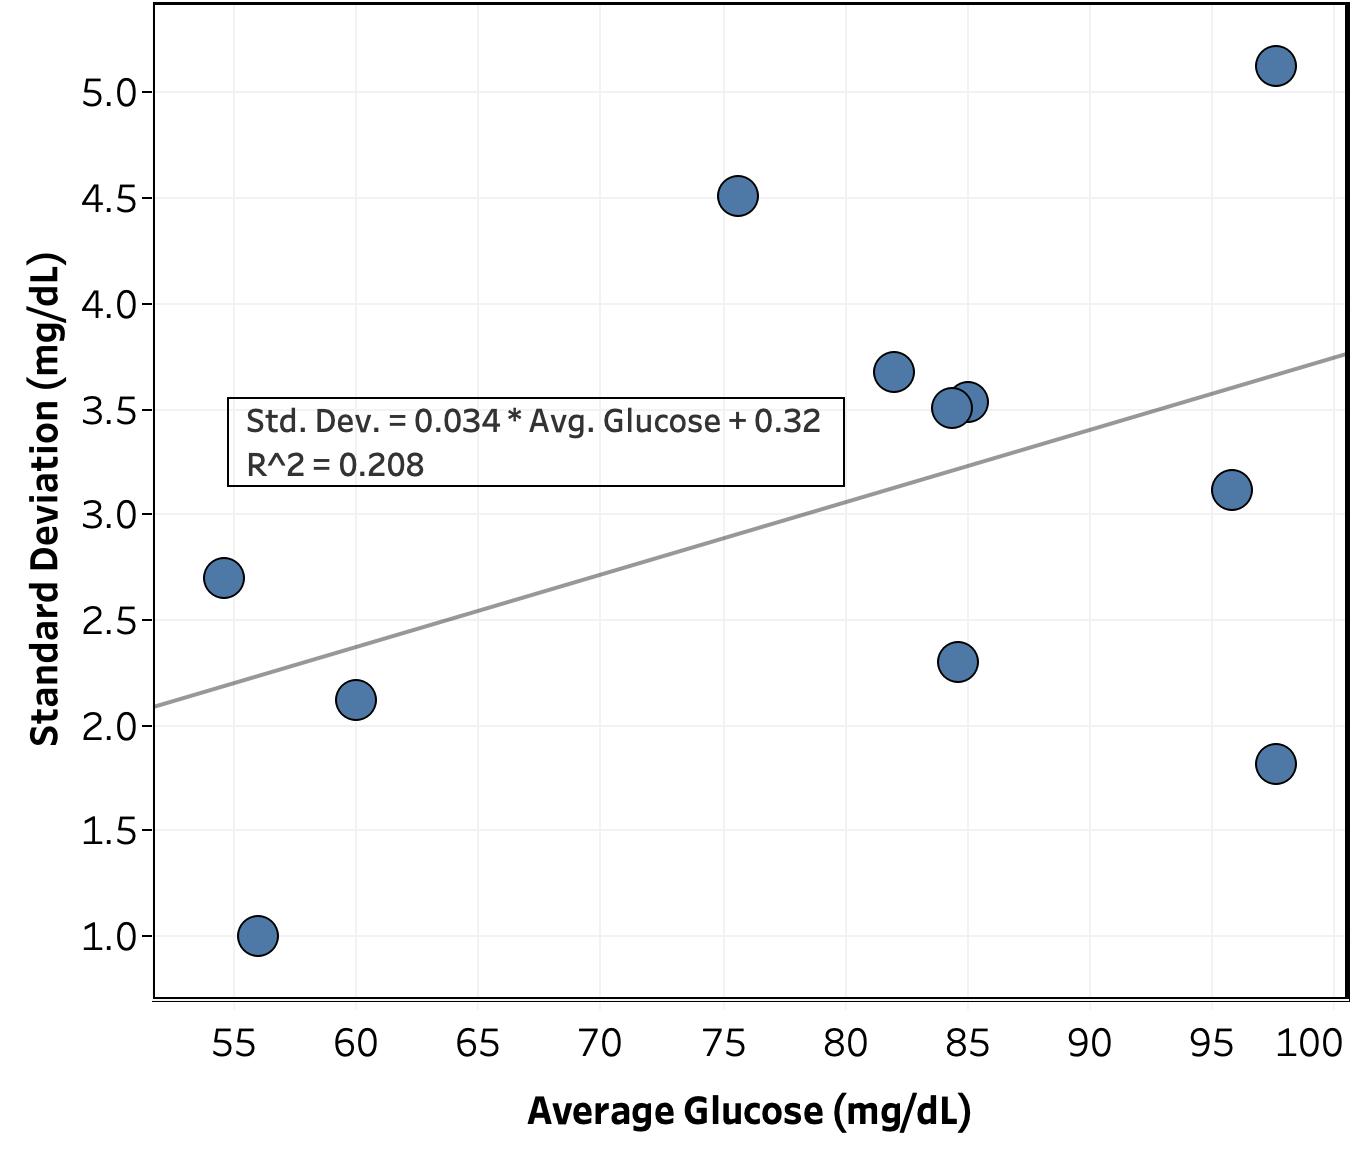
To start with, I’m going to post once each week. Next week, I’ll start with my first experiments to assess the precision and accuracy of my blood glucose measurements.


– QD