Get new posts by email or rss feed
This self-experiment was done as part of the Keating Memorial Self-Research Project. If you’d like to read about the other other experiments, you can find them here.
Since I started self-experimenting to better manage my diabetes, one of the things I was most interested in was the effect of different foods on blood sugar. I follow a low-carb/keto diet and I was particularly interested in confirming if low-carb flour and sugar replacements (e.g. oat-fiber, inulin, allulose, etc.) really have as little impact as claimed.
When I first tried this, I added ingredients to my normal meals measured the change in my normal BG trends. This proved too noisy and I couldn’t get a clean measure of the effect of even pure glucose in a reasonable number of measurements (design, results).
For these experiments, I isolated the effect of the ingredient being tested by fasting for 17 h before eating/drinking. This worked really well and I was able to get reliable measurements and some (hopefully) interesting insights.
I hope some people find this interesting. If you have any questions, comments, or suggestions for future experiments, I’d love to know.
Lastly, if you’re interested in joining in any future experiments, let me know in the comments or send a via the contact form or to quantifieddiabetes_at_gmail.com.
Summary
Approach
- Design experiments and solicit feedback: blog, Reddit, OpenHumans
- Establish fasting baseline & determine time of day for experiments
- Food effect measurements:
- Carbohydrates: glucose, corn starch
- Protein & fat: whey protein, olive oil
- Fibers: oat fiber, resistant wheat starch, inulin
- Non-nutritive sweeteners: allulose, erythritol
- Combination effect: glucose + oat fiber
Results for ingredients without links are in this post.
Key results
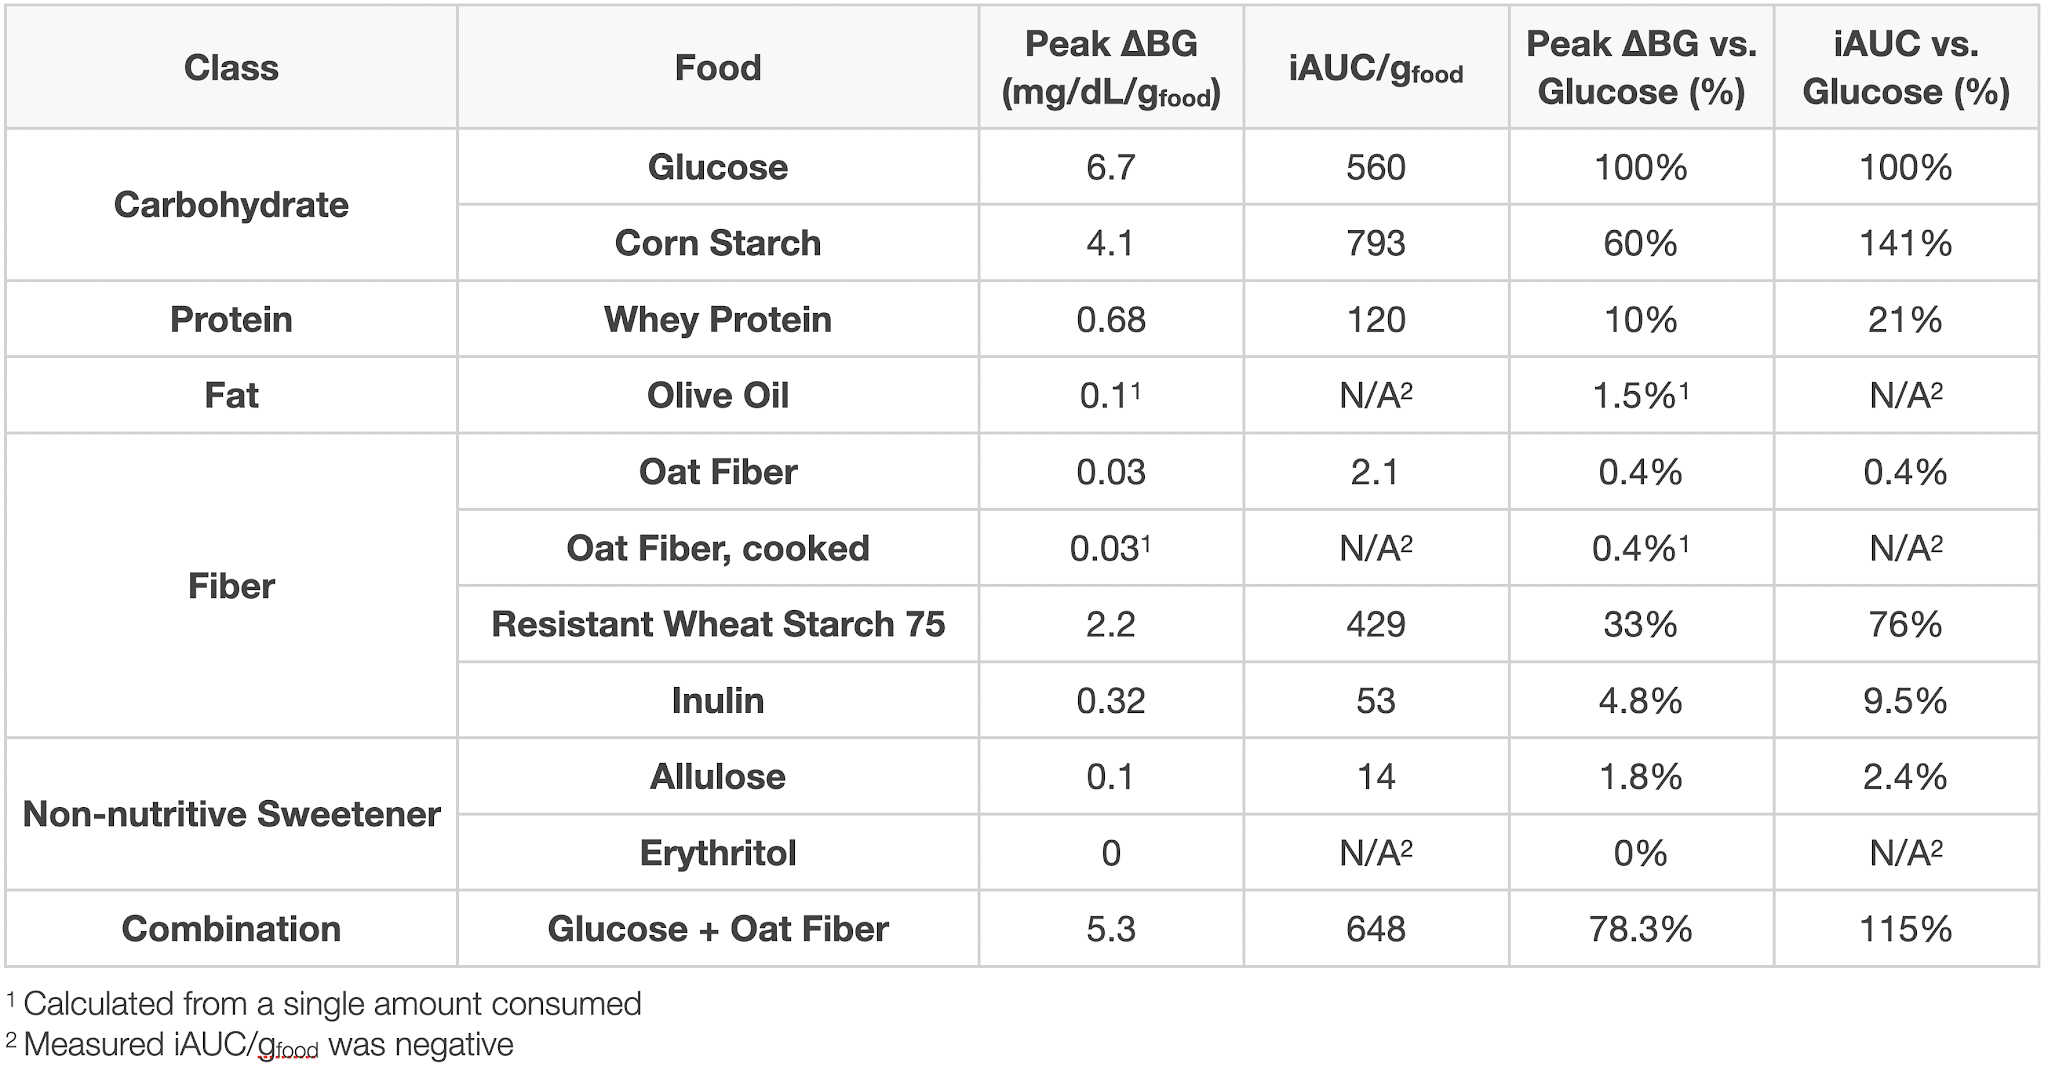
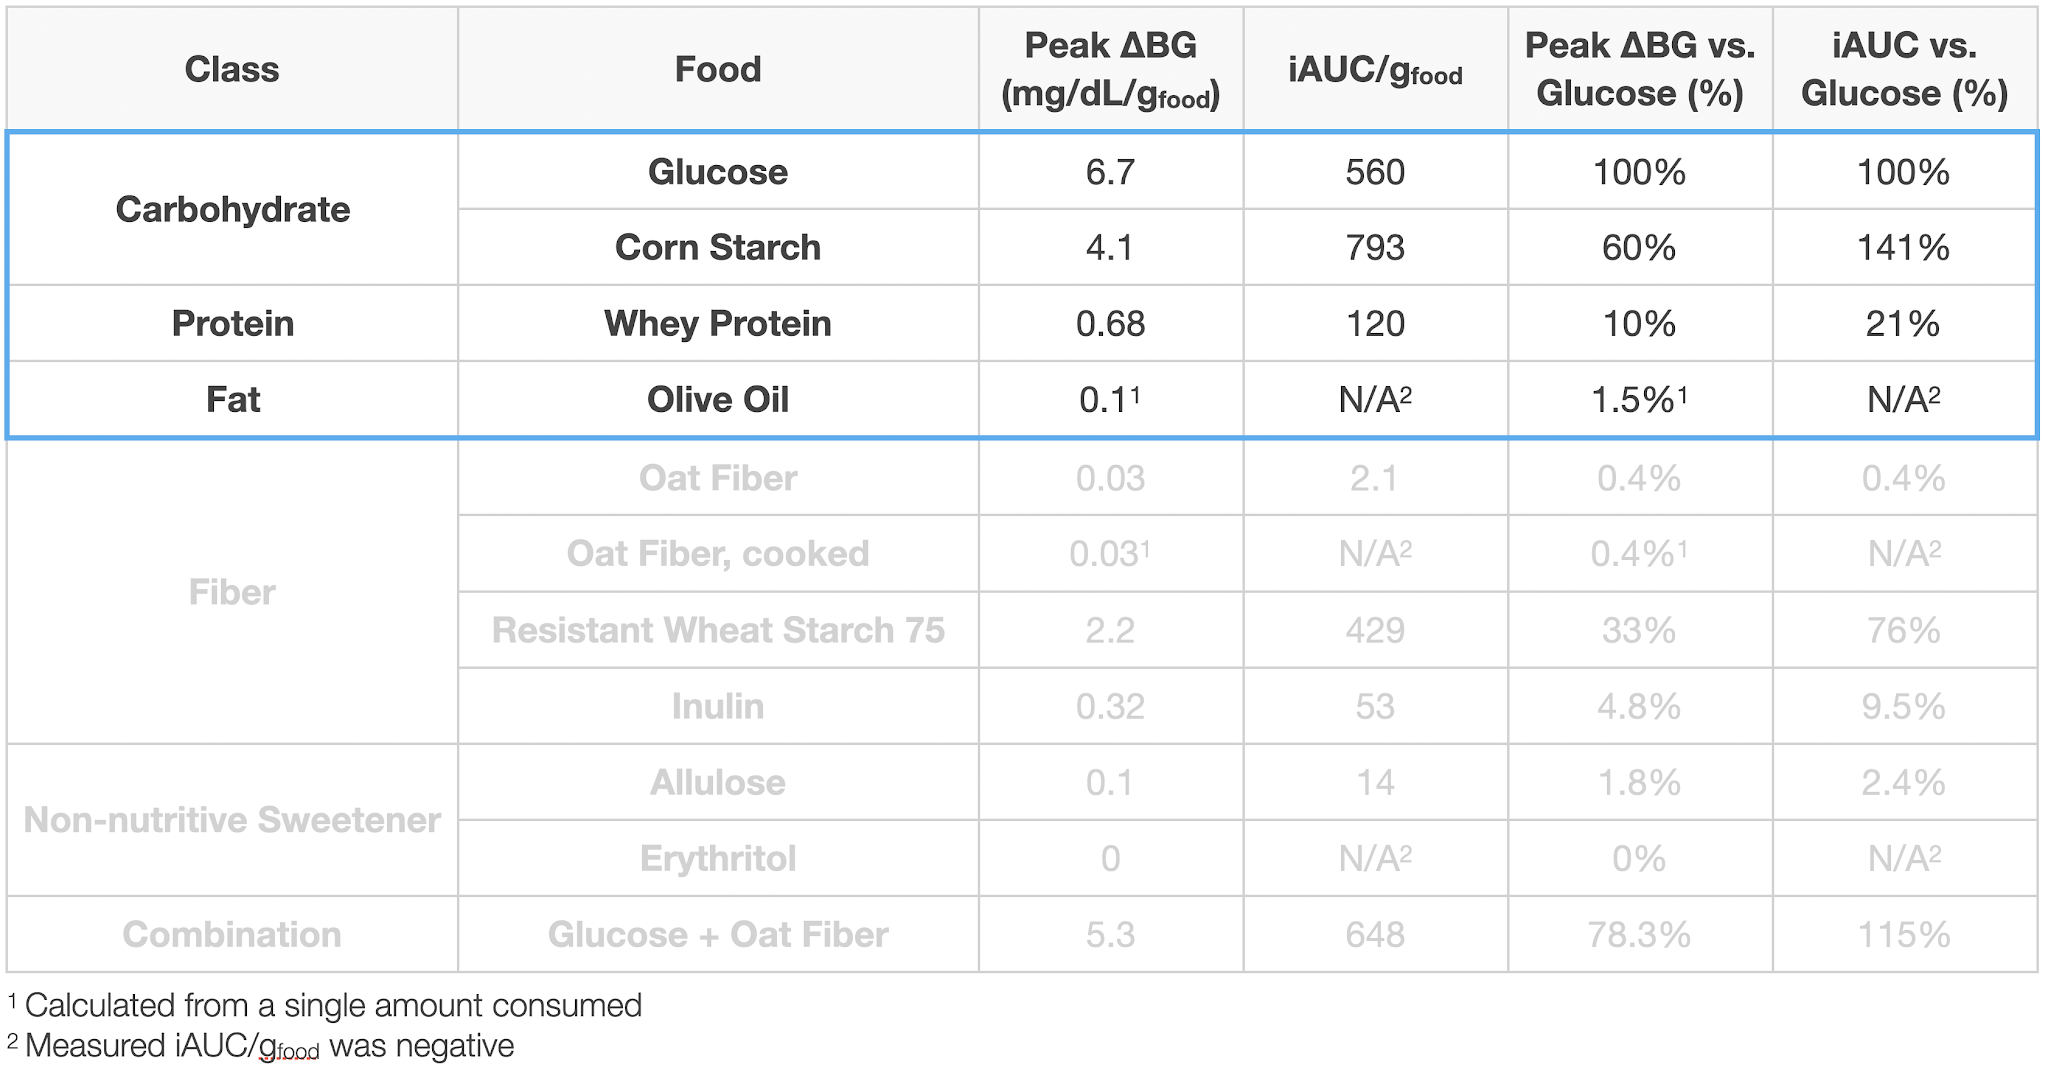
- The main macronutrients, carbohydrates, protein, and fat have the expected impact. Notably:
- Contrary to some claims I’ve read, fat had virtually zero impact on my blood sugar.
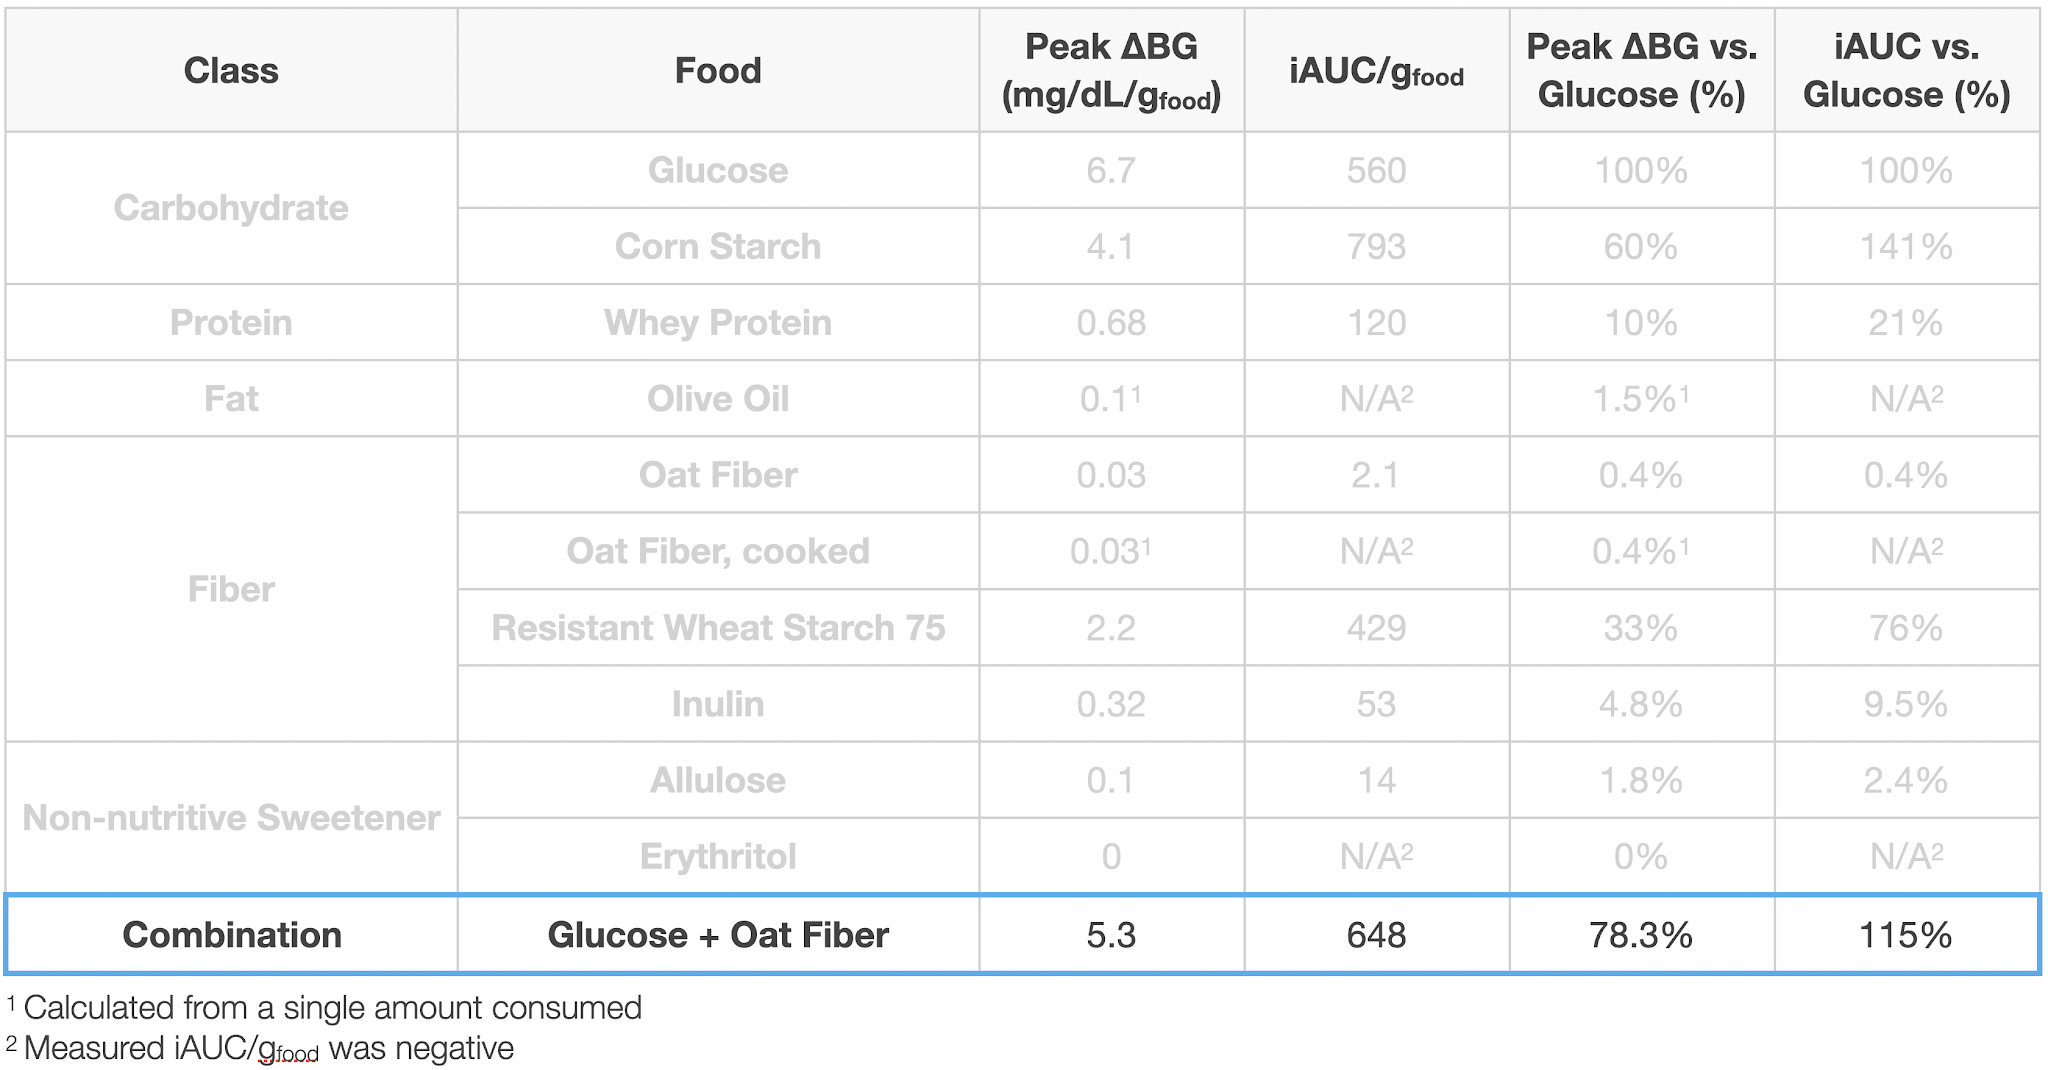
- Starch and glucose had nearly the same impact, though slightly delayed in time. This suggests that for purposes of carbohydrate counting, I can treat all digestible carbohydrates the same.
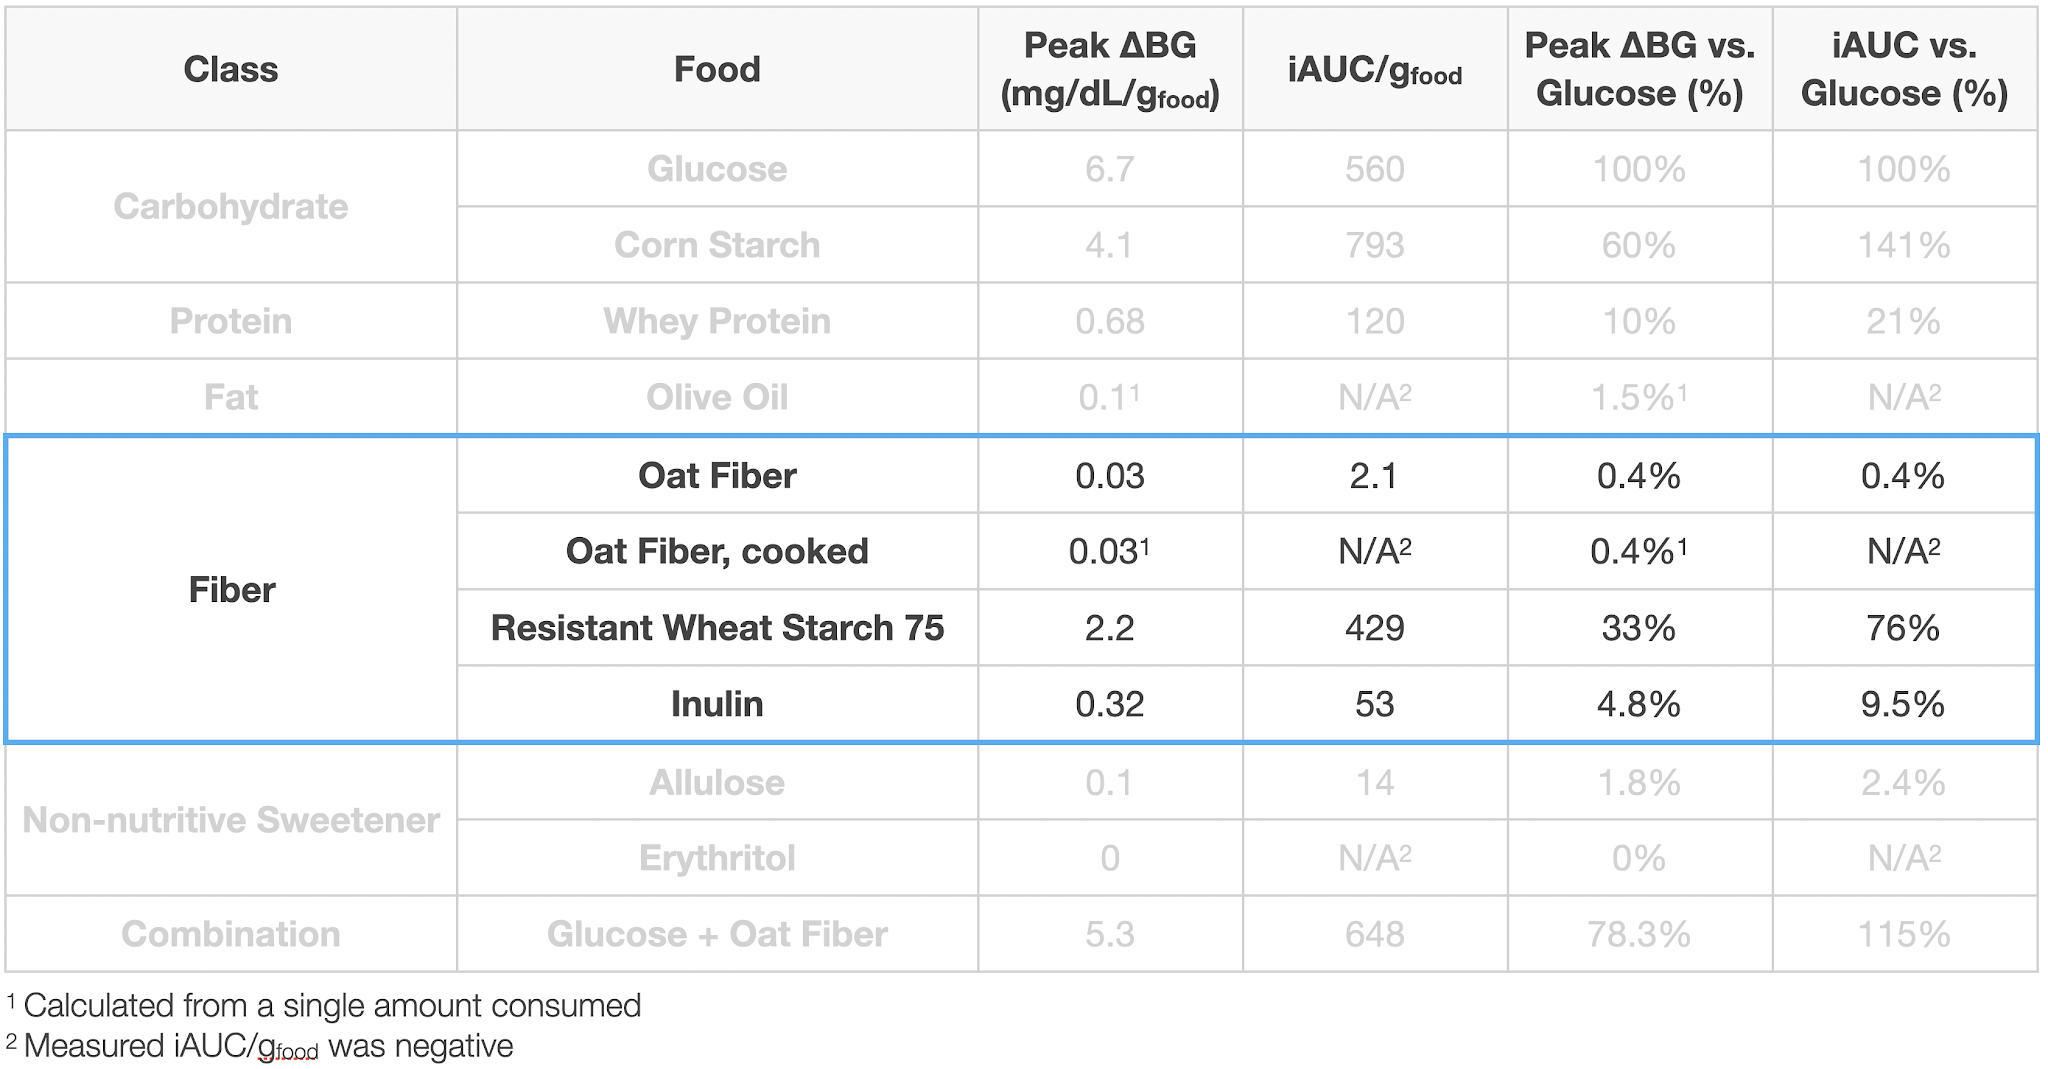
- Insoluble or “indigestible” fiber had a wide range of impact, from near zero for oat fiber, ~10% of glucose for inulin, to 76% of glucose for resistant wheat starch.
- This is extremely disconcerting, as both oat fiber (iAUC 0.4% of glucose) and resistant wheat starch (iAUC 75% of glucose) are listed as insoluble fiber on nutrition labels, but have radically different impact on blood sugar. Given the lack of clarity and quantification of ingredient lists, this makes it nearly impossible to predict the blood glucose impact of a food without eating it and testing.
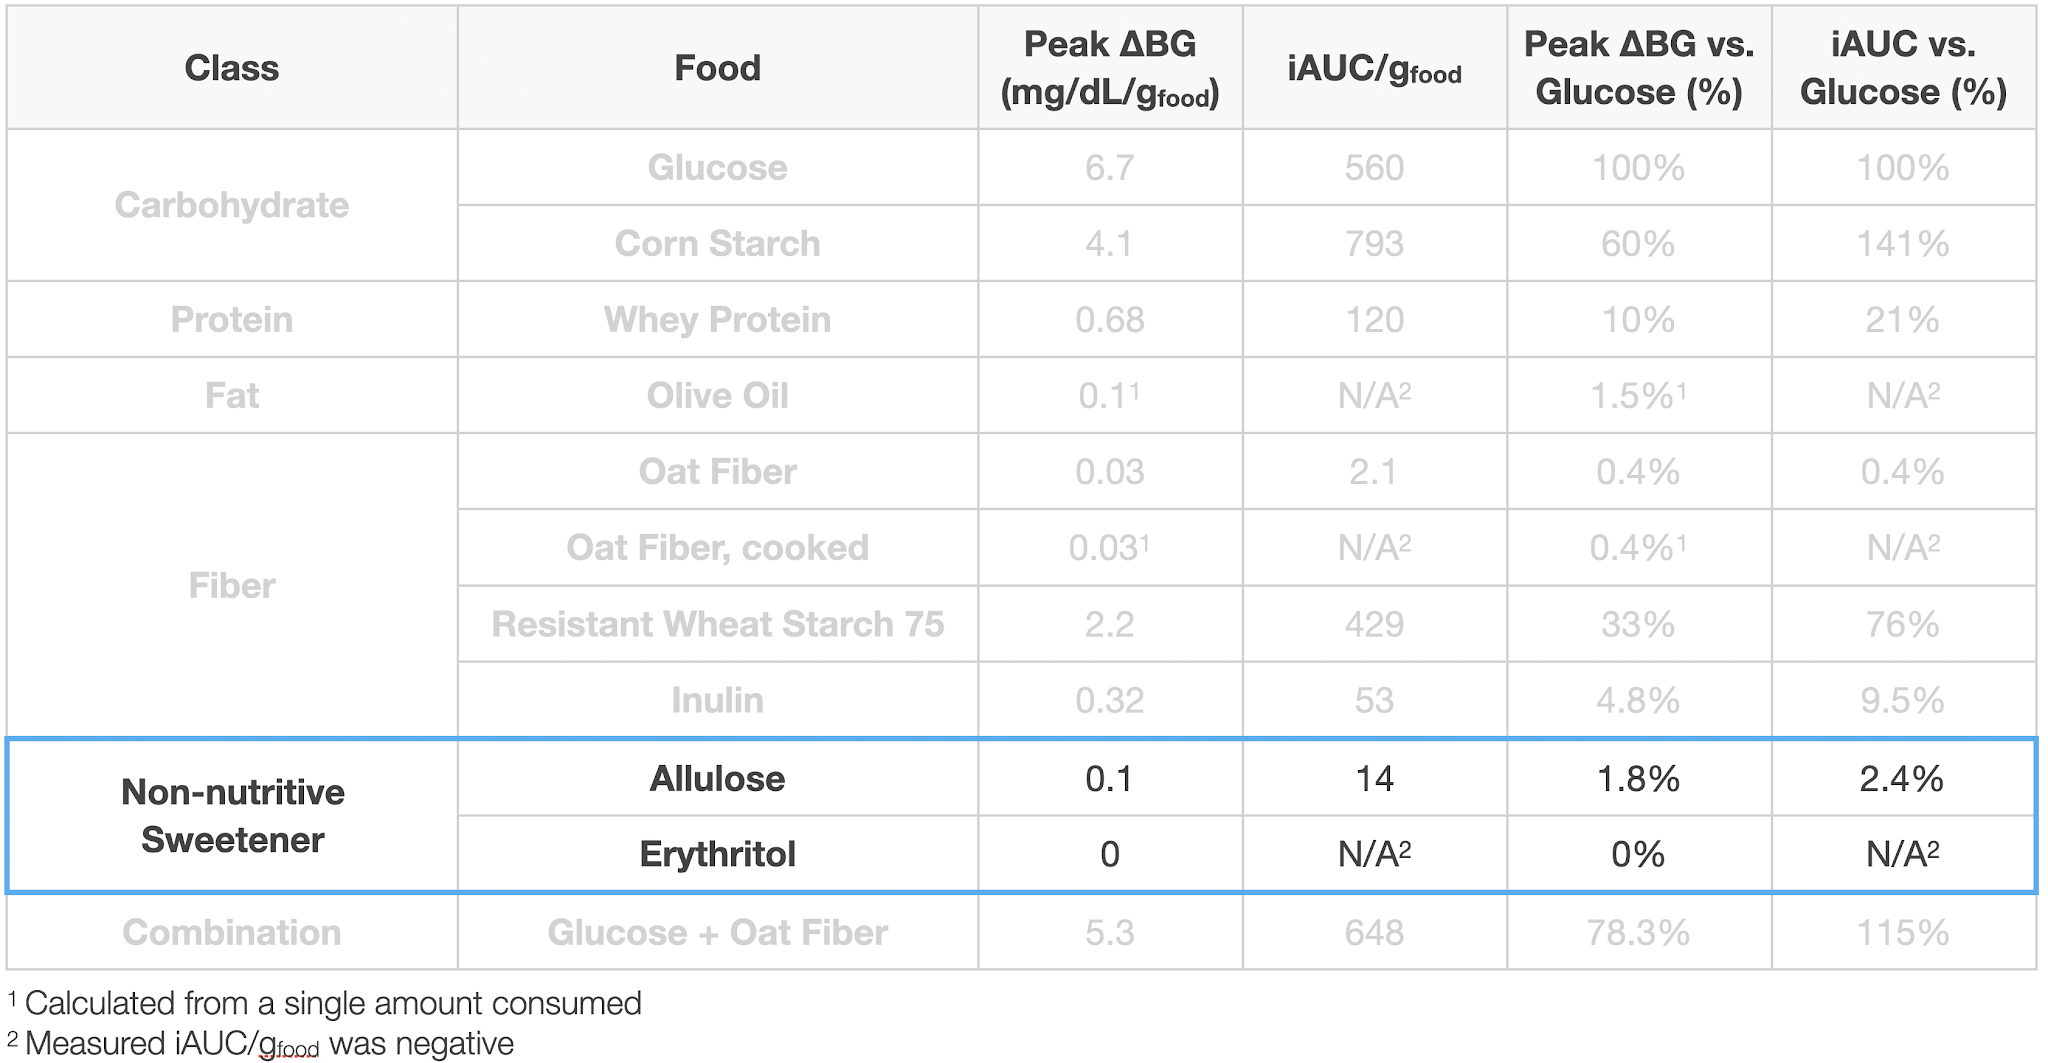
- My two preferred non-nutritive sweeteners, allulose and erythritol had negligible impact on my blood glucose.
- Adding oat fiber to glucose had a negligible impact on blood glucose, though the time to peak was increased by 30 min. Further testing with different types of fiber and other macronutrients would be required to get a better handle on this effect, but the initial results suggest that while fiber might have an impact on rate of glucose absorption, it’s not signifiant enough to change the blood glucose impact for insulin-dependent diabetics (might be very different for someone who makes more endogenous insulin).
Details
Purpose
To quantify the effect of ingestion of food ingredients and ingredient combinations on my blood sugar.
Background on Ingredients
Glucose. The most common type of simple sugar used in living organisms. It is used as an energy source through aerobic respiration, anaerobic respiration (in bacteria), or fermentation.
Corn starch. Starch derived from the endosperm of corn kernels. Chemically, it’s a polymer of glucose and is readily hydrolyzed by amylase enzymes in the saliva or acid in the sy]tomach.
Whey Protein. A complete protein extracted from milk whey. It’s the most popular protein supplement due to its ease of digestion, rapid absorption, and appreciable content of all 9 essential amino acids.
Olive Oil. A cooking oil that’s high in unsaturated fats, primarily oleic, linoleic, and palmitic acid. It’s used extensively in cooking.
Oat Fiber. An insoluble fiber made from grinding the shells of oat kernels. It’s purported to be completely indigestible, making it a great partial replacement for flour in low-carb baking when you don’t want the increased calories of almond or coconut flour. I personally have found it to be useful for making protein muffins and chocolate chip & coconut cookies.
Resistant starch. A starch that, purportedly, is not digested in the small intestine and therefore doesn’t increase blood sugar when consumed. There are four different classes of resistant starches, RS1-4, which differ based on how they’re formed and the method by which they resist digestion. Resistant wheat starch is RS4, meaning it was chemically modified to resist digestion in the small intestine.
Inulin. A soluble fiber found in many plants. Inulin is used in many processed foods to modify texture, increase bulk, and/or replace fat and sugar. It is indigestible by human enzymes and so passes through much of the digestive system intact before being (partially) metabolized by bacteria in the colon.
Allulose. A sugar substitute with very similar physical properties to table sugar. This makes it particularly useful in low carb baking or any recipe where sugar provides texture as well as taste. I personally have found it particularly useful for making ice cream, cookies, and syrup.
Erythritol. A sugar alcohol produced by glucose fermentation and used as a non-nutritive sweetener. It’s 60-70% as sweet as sucrose and not metabolized, making it almost zero calories. It’s dissolution in water is strongly endothermic, resulting in a “mouth cooling” effect that some people find unpleasant.
Design/Methods
Procedure. From 7 pm the day before through 4:30p the day of experiment, no food or calorie-containing drinks were consumed and no exercise was performed. Non-calorie-containing drinks were consumed as desired (water, caffeine-free tea, and decaffeinated coffee). At ~12 pm, the substance to be tested was dissolved or suspended in 475 mL of water and ingested as rapidly as comfortable. BGM measurements were then taken approximately every 15 min. for 2 h or until blood glucose had returned to baseline, whichever was longer. A final BGM measurement was taken 4.5 h after ingestion.
Measurements. Blood glucose was measured using a FreeStyle Freedom Lite glucose meter with FreeStyle lancets & test strips. No special precautions were taken to clean the lancing site before measurement. To take a sample, the lancing devices was used to pierce the skin at an ~45° angle from the finger. Blood was then squeezed out by running the thumb and pointer finger of the opposite hand from the first knuckle to the lancing site of the finger. Blood was then wicked into a test strip that had been inserted into the meter and the glucose reading was recorded.
Data Processing & Visualization. iAUC was calculated using the trapezoid method (see data spreadsheet for details). Data was visualized using Tableau.
Medication. I took my normal morning and evening medication, but did not dose for the experimental food ingested.
Data
Results & Discussion
Establishing baseline
Additional details here: baseline.
To determine the best time of day to measure the effect of food ingredients on my blood sugar, I monitored my blood sugar on three separate days while fasting. Based on the results, for all experiments in this study, I started fasting 7p the night before and started the measurement at 12p.
Macronutrients
Additional details here: Glucose, Whey protein & olive oil.
Glucose was used as the baseline for comparison for all other ingredients. It raises my blood sugar by 6.7 mg/dL/gglucose, with the peak occurring from 45-75 min. after ingestion. Results were extremely linear with amount consumed, with a slightly better fit when using incremental area under the curve (iAUC) vs. the peak increase (R2 = 0.988 vs. 0.983).
Corn starch had virtually the same effect as glucose, with an increase of 141% (by iAUC), but with a slower rise (110 vs. 76 min. for higher amounts consumed). This resulted in a slightly lower peak, 4.1 mg/dL/g(cornstarch) or 76% that of glucose.
Whey protein isolate increases my blood sugar by ~20% that of glucose (by iAUC), but with a slower rise. This result sin a lower peak, 0.68 mg/dL/g(whey) or 10% that of glucose, but a long tail of increased blood sugar, ~0.4 mg/dL/g(whey) @ 4.5 h.
Olive oil had a negligible effect on my blood sugar, ~0.1 mg/dL/g(olive oil) for ~350 kcal of oil, or 1.5% that of glucose.
This is mostly consistent with the medical literature. The two most interesting observations for me were:
- Fat had virtually zero impact on my blood sugar. I’ve read a lot of posts and comments by people who dose a small amount of insulin based on the fat content of a meal. The claim is that it does increase their blood glucose, though much less than carbohydrates or proteins. My (limited) measurements do not show this.
- If anyone reading this does see blood glucose rise with fat intake and is interested in doing a joint experiment to measure it, please let me know in the comments or send a PM via the contact form or to quantifieddiabetes_at_gmail.com.
- Cornstarch had virtually the same impact on as glucose, just slightly delayed in time. Given the difference in their glycemic index (100 vs. 70), I would have expected a larger effect. That said, this suggests that for purposes of carbohydrate counting, I can treat all digestible carbohydrates the same.
Fiber
Additional details here: Oat fiber, resistant wheat starch.
Fiber was the most interesting and disturbing category. I looked at oat-fiber, resistant wheat starch, and inulin, all of which are claimed to be indigestible and have minimal impact on blood sugar (see ingredient backgrounds, above). Their actual impact on blood glucose, however, varied widely, ranging from near zero for oat fiber, ~10% of glucose for inulin, to 76% of glucose for resistant wheat starch.
This is extremely disconcerting, as both oat fiber (iAUC 0.4% of glucose) and resistant wheat starch (iAUC 75% of glucose) are listed as insoluble fiber on nutrition labels, but have radically different impact on blood sugar. Given the lack of clarity and quantification of ingredient lists, this makes it nearly impossible to predict the blood glucose impact of a food without eating it and testing.
Non-nutritive Sweeteners
Additional details here: Allulose.
The non-nutritive sweeteners I tried were a lot more promising. Both allulose and erythritol, my two favorite sweeteners, had negligible effect on my blood glucose up to the maximum quantity.
Glucose + Fiber
Many people claim that fiber can slow the absorption of sugar, helping to control blood sugar levels. Soluble fiber is generally claimed to have a stronger effect, but most soluble fibers are digestible and would contribute to blood sugar rise. Given that, I decided to test if oat fiber, and insoluble, indigestible fiber would slow blood sugar increase.
Towards that end, I tested glucose with an additional 44g of oat fiber. The impact on blood glucose was the same within the error of the measurement, but the time to peak was increased by 30 min. Further testing with different types of fiber and other macronutrients would be required to get a better handle on this effect, but the initial results suggest that while fiber might have an impact on rate of glucose absorption, it’s not signifiant enough to change the blood glucose impact for insulin-dependent diabetics (might be very different for someone who makes more endogenous insulin).
Final Thoughts & Next Experiments
Key results in the Summary section above.
Overall, the experiment was successful, yielding a reliable measure of the impact of the major macronutrients and my most commonly used low-carb ingredients. I also got preliminary insight into the interaction effect between glucose and insoluble fiber.
Due to external circumstances, I didn’t get to as many ingredients as I’d have liked. I may come back and do further experiments. I’m particularly interested in testing a wider range of purportedly low-carb ingredients and diving deeper into interaction effects (maybe looking foods with a range of different carbohydrate:protein:fat:fiber).
That said, these experiments were very time consuming and the frequent extended fasts were disruptive to my normal routine. I need to either find a simpler/easier experimental protocol or get more people to join in to accelerate data collection.
In the meantime, my plan for next experiments is:
- Re-tune basal and bolus (meal) insulin doses
- My routine has changed a lot due to working from home, changing doctors, and changing medication (due to insurance requirements). Plus, I was able to get a Dexcom G6 CGM, which is showing accuracy comparable to my blood glucose meter. Blood sugars are still good, but I think I can get them better.
- Re-measure blood sugar impact of glucose and insulin; compare to previous data
- While working from home, I’ve gained some weight (and hopefully muscle). This has resulted in a change in my insulin sensitivity. Not huge, but I need to remeasure to have an accurate baseline for future experiments.
- Test the effect of some dietary supplements that have been reported to affect blood sugar in the literature, but where data insufficient or contradictory
- Vitamin C (reported to cause blood glucose meters to read higher than actual, but all measurements I can find are for injected vitamin C)
- Glutamate (reported to reduce post-prandial glucose, but magnitude and timing vary widely)
- Others tbd.
As always, if you have any questions, comments, suggestions, or are interested in joining in future experiments, please let me know in the comments or send a PM via the contact form or to quantifieddiabetes_at_gmail.com.
– QD
Hi! I love how informative and great your articles are. Can you recommend a list of citrus fruits and vegetables that can be used to make healthy snacks or treats? Thanks a lot!
I eat very low-carb, so fruits are out for me, but here's a list of low glycemic index food: nhrmc.org/~/media/testupload/files/low-gylcemic-meal-planning.pdf?la=en
My favorites for vegetables are broccoli, spinach, and zucchini, but that's just a personal preference.
Hi, my adult son is just a few clicks below Type 2 diabetic. He weighs too much–230–and is very addicted to sugar. He has come to live with me. I have been making low carb sweets for him using Splenda but then read on one site that it does raise blood sugar, so switched to a blend of sweeteners recommended on joyfilledeats.com. Do you think you could take a look at the ingredients? It uses erythritol but I don’t know if that alone will work to satisfy his craving for sweets! Here’s the joyfilledeats recipe:
Cup measurements:
▢1 ½ cups plus 2 tablespoons erythritol
▢2 cups plus 2 tablespoons xylitol
▢2 teaspoon Better Stevia or any pure stevia extract
Instructions
Powdered Sweetener
Process the ingredients in the food processor for a few minutes if you are planning on using it in chocolate, beverages, or icing.
Granular Sweetener
For baking and candy making, you can just mix the ingredients together by hand.
I would be very grateful!
Stevia and erythritol are zero calorie and, as best I can measure, zero blood glucose impact.
Xylitol is 2.4 cal/g and raises blood sugar by about 50% of the same weight of sugar, though a bit slower. Depending on you/your son’s targets, that can be ok, but there are other options that I find better.
Allulose is very similar to regular sugar in taste and texture, doesn’t have the cooling effect of erythritol, and is zero calorie/zero blood glucose impact. It gives things a softer texture than regular sugar, but that can be good or bad depending on what you’re going for.
In cooking, I typically use allulose for anything liquid, and blends of allulose & erythritol for anything solid, varying the ratio depending on the texture I’m going for.
One other note: powdered Splenda raises blood sugar because they mix the sucralose with dextrose. Liquid sucralose (available on Amazon) does not raise blood glucose.
PS to my query, I know you already said erythritol has 0% effect on BG, so I think I’m asking what you know about Stevia (pure extract) and xylitol (besides that the latter can kill a dog).
Thanks for going to the effort of publishing all this data!
Maybe this is TMI, but I would love an additional note if you had digestive distress from any ingredients tested. Some types of added fiber can give me terrible stomach pain afterward. I’ve also initially enjoyed allulose in frozen treats and Magic Spoon but over time it started to taste terrible to me and I struggle to eat anything with allulose anymore and I wonder if long term it loses its ability to taste good to some people. Anyway, I really appreciate everything you do, I was diagnosed with T1D a few months ago and found your blog because I’ve been struggling to dose insulin for low carb wraps due to different fiber used I suspect. Keep up the great work!
I tried to note in the posts if/when I had digestive issues. In general, I can eat about 50g of a sugar alcohol or allulose without digestive issues, but any more than that and I have problems. I suspect I built up a tolerance for it over time, though. When I don’t have sugar alcohols for awhile and then have a significant amount, I will sometimes have digestive issues at lower quantities.