Get new posts by email or rss feed
This self-experiment is being done as part of the Keating Memorial Self-Research Project. A couple of other people from the Open Humans community are also running the same experiments. If you’re interested in joining in, let me know in the comments or send me a PM.
This post is an update on my experiments measuring the effect of food ingredients on blood sugar.
Plan:
- Design experiments and solicit feedback: blog, Reddit, OpenHumans
- Calibrate continuous blood glucose meter: started 2/18, report tbd.
- Establish fasting baseline & determine time of day for experiments: Complete
- Food effect measurements
This week, I have the results from resistant wheat starch.
Summary
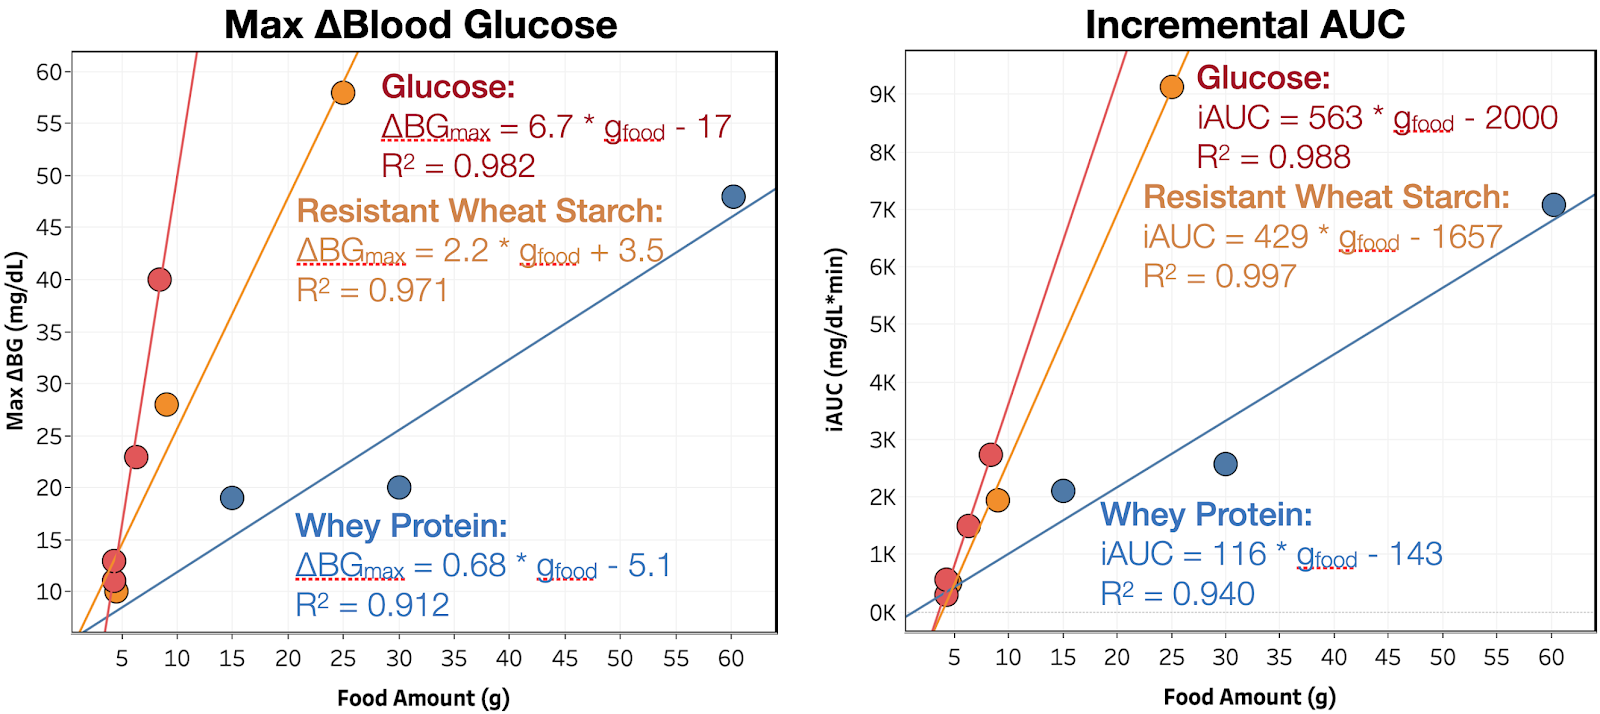
Resistant wheat starch, despite claims that it is not digested and doesn’t raise blood glucose, increases my blood sugar by 76% that of glucose (by iAUC), but with a slower rise, lower peak (33% that of glucose), and much longer tail.
This is especially problematic for predicting the blood glucose impact of foods from their nutrition information as based on my data so far, even insoluble fibers can range in impact from 0.4 – 76% of glucose.
Next week I’ll finish out the major macronutrient groups with cornstarch. Still deciding where to go after that, but it will either be more ingredients used in low carb cooking (inulin, erythritol, soluble corn fiber, lupin flour) or mixtures of the major macronutrients (to measure combinations effects.

Details
Purpose
To quantify the effect of ingestion of food ingredients and ingredient combinations on my blood sugar.
Ingredient Background
Resistant starch is starch that, purportedly, is not digested in the small intestine and therefore doesn’t increase blood sugar when consumed. There are four different classes of resistant starches, RS1-4, which differ based on how they’re formed and the method by which they resist digestion. Resistant wheat starch is RS4, meaning it was chemically modified to resist digestion in the small intestine.
Design/Methods
Procedure. From 7 pm the day before through 4:30p the day of experiment, no food or calorie-containing drinks were consumed and no exercise was performed. Non-calorie-containing drinks were consumed as desired (water, caffeine-free tea, and decaffeinated coffee). At ~12 pm, the substance to be tested was dissolved or suspended in 475 mL of water and ingested as rapidly as comfortable. BGM measurements were then taken approximately every 15 min. for 2 h or until blood glucose had returned to baseline, whichever was longer. A final BGM measurement was taken 4.5 h after ingestion.
Measurements. Blood glucose was measured using a FreeStyle Libre flash glucose monitor and a FreeStyle Freedom Lite glucose meter with FreeStyle lancets & test strips. No special precautions were taken to clean the lancing site before measurement. To take a sample, the lancing devices was used to pierce the skin at an ~45 deg. angle from the finger. Blood was then squeezed out by running the thumb and pointer finger of the opposite hand from the first knuckle to the lancing site of the finger. Blood was then wicked into a test strip that had been inserted into the meter and the glucose reading was recorded.
Data Processing & Visualization. iAUC was calculated using the trapezoid method (see data spreadsheet for details). Data was visualized using Tableau.
Medication. I took my normal morning and evening medication, but did not dose for the experimental food ingested.
Data
Results & Discussion
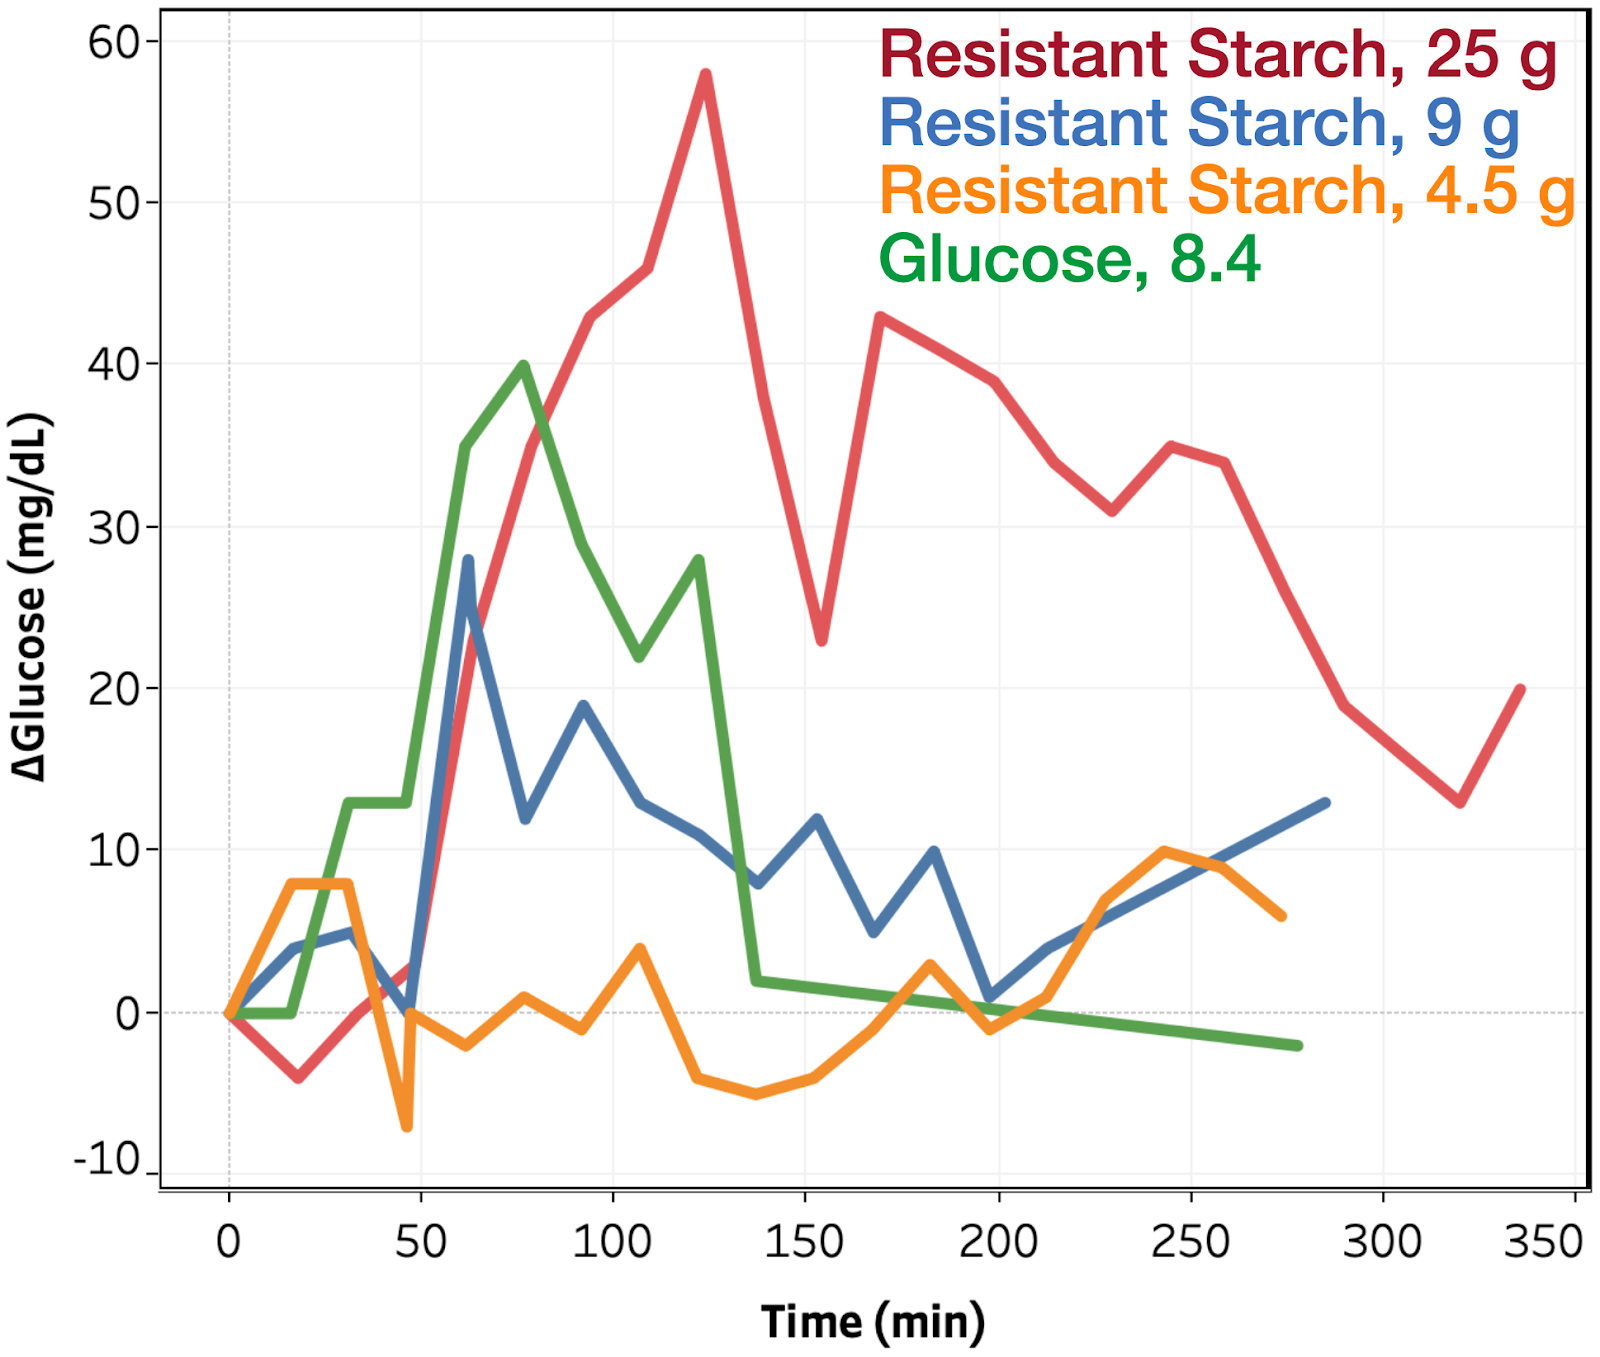
Changes in blood glucose as a function of time for the resistant wheat starch and glucose tests are shown in Figure 1. For resistant wheat starch, I observe an increase in blood glucose starting at ~45 min. and reaching a peak between 75-120 min. While the timing is similar to that of whey protein, the magnitude of impact is much larger, with the peak change in blood glucose and iAUC increasing by 33% and 76% vs. glucose. It will be interesting to see next week how regular corn starch compares to resistant wheat starch and therefore if the chemical modifications to resist digestion are having any meaningful impact.
Conclusion & Next Experiments
Resistant wheat starch, despite claims that it is not digested and doesn’t raise blood glucose, increases my blood sugar by 76% that of glucose (by iAUC), but with a slower rise, lower peak (33% that of glucose), and much longer tail.
Put together, this indicates that resistant wheat starch is slower to digest than glucose, but contrary to the claims above, is clearly still metabolized to glucose. This is extremely disconcerting, as both oat fiber (iAUC 0.4% of glucose) and resistant wheat starch (iAUC 75% of glucose) are listed as insoluble fiber on nutrition labels, but have radically different impact on blood sugar. Given the lack of clarity and quantification of ingredient lists, this makes it nearly impossible to predict the blood glucose impact of a food without eating it and testing.
Next week I’ll finish out the major macronutrient groups with cornstarch. Still deciding where to go after that, but it will either be more ingredients used in low carb cooking (inulin, erythritol, soluble corn fiber, lupin flour) or mixtures of the major macronutrients (to measure combinations effects.
– QD