Get new posts by email or rss feed
This self-experiment is being done as part of the Keating Memorial Self-Research Project. A couple of other people from the Open Humans community are also running the same experiments. If you’re interested in joining in, let me know in the comments or send me a PM.
This post is an update on my experiments measuring the effect of food ingredients on blood sugar.
Plan:
- Design experiments and solicit feedback: blog, Reddit, OpenHumans
- Calibrate continuous blood glucose meter: started 2/18, report tbd.
- Establish fasting baseline & determine time of day for experiments: Complete
- Food effect measurements
This week, I have the results from whey protein and olive oil.
Summary
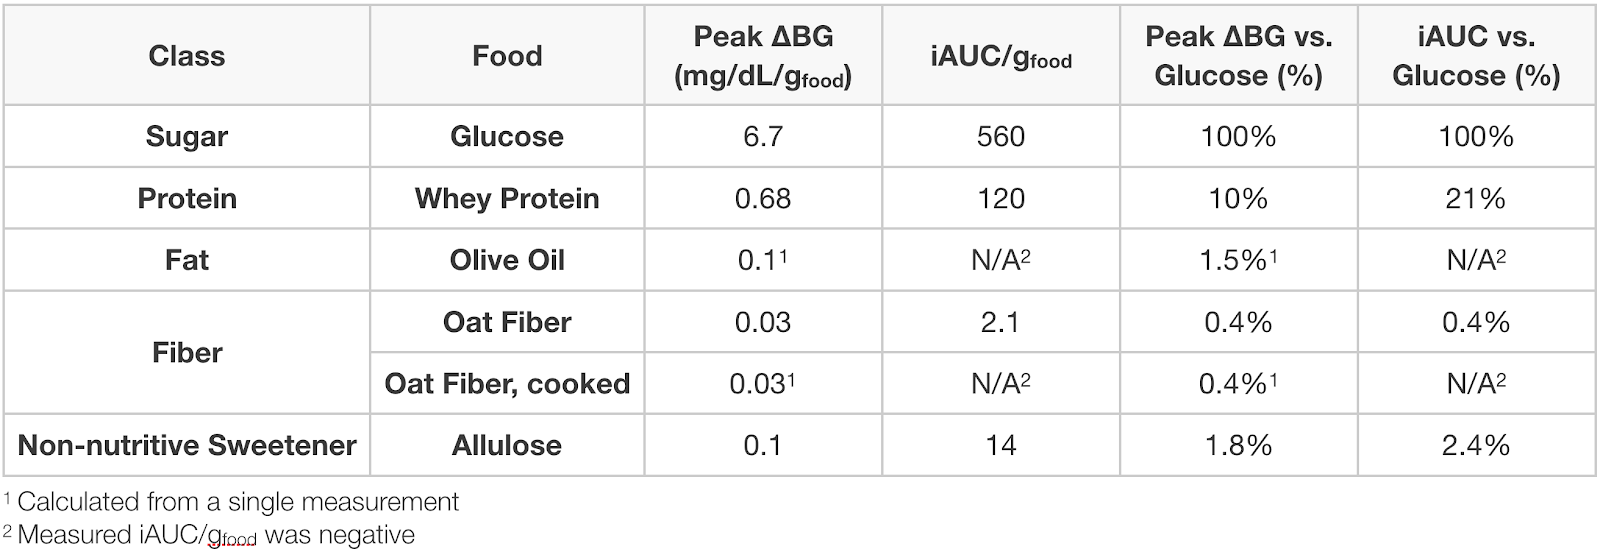
Olive oil had a negligible effect on my blood sugar, ~0.1 mg/dL/g(olive oil) for ~350 kcal of oil, or 1.5% that of glucose.
Whey protein isolate increases my blood sugar by ~20% that of glucose (by iAUC), but with a slower rise. This result sin a lower peak, 0.68 mg/dL/g(whey) or 10% that of glucose, but a long tail of increased blood sugar, ~0.4 mg/dL/g(whey) @ 4.5 h.
Still deciding what to try next, but it will either be corn starch (to have an example from each major macronutrient), resistant starch (fiber with disputed claims to non-digestibility), or combinations of protein, fat, or fiber with sugar.

Details
Purpose
To quantify the effect of ingestion of food ingredients and ingredient combinations on my blood sugar.
Ingredient Background
Whey protein isolate is a complete protein extracted from milk whey. It’s the most popular protein supplement due to its ease of digestion, rapid absorption, and appreciable content of all 9 essential amino acids.
Olive oil is a cooking oil that’s high in unsaturated fats, primarily oleic, linoleic, and palmitic acid. It’s used extensively in cooking.
Design/Methods
Procedure. From 7 pm the day before through 4:30p the day of experiment, no food or calorie-containing drinks were consumed and no exercise was performed. Non-calorie-containing drinks were consumed as desired (water, caffeine-free tea, and decaffeinated coffee). At ~12 pm, the substance to be tested was dissolved or suspended in 475 mL of water and ingested as rapidly as comfortable. BGM measurements were then taken approximately every 15 min. for 2 h or until blood glucose had returned to baseline, whichever was longer. A final BGM measurement was taken 4.5 h after ingestion.
Measurements. Blood glucose was measured using a FreeStyle Libre flash glucose monitor and a FreeStyle Freedom Lite glucose meter with FreeStyle lancets & test strips. No special precautions were taken to clean the lancing site before measurement. To take a sample, the lancing devices was used to pierce the skin at an ~45 deg. angle from the finger. Blood was then squeezed out by running the thumb and pointer finger of the opposite hand from the first knuckle to the lancing site of the finger. Blood was then wicked into a test strip that had been inserted into the meter and the glucose reading was recorded.
Data Processing & Visualization. iAUC was calculated using the trapezoid method (see data spreadsheet for details). Data was visualized using Tableau.
Medication. I took my normal morning and evening medication, but did not dose for the experimental food ingested.
Data
Results & Discussion


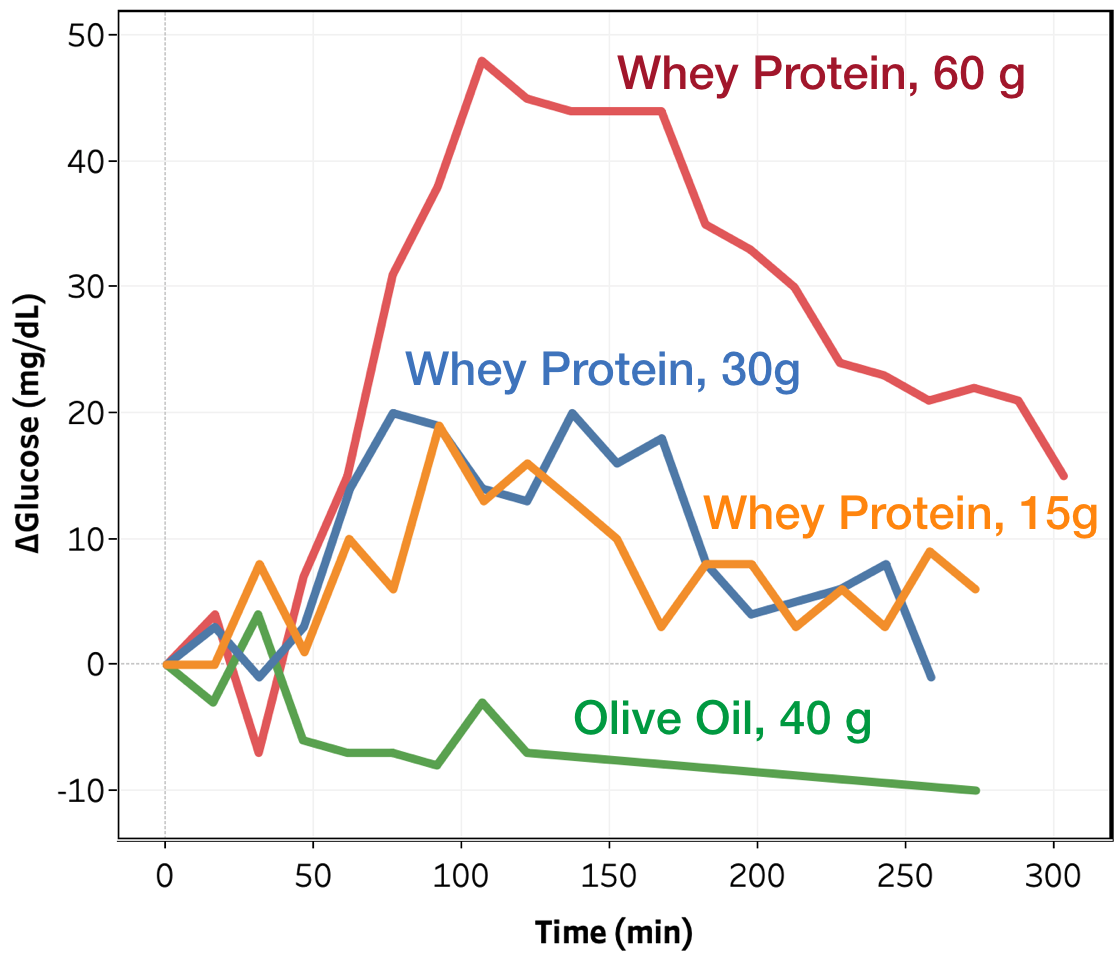
Changes in blood glucose as a function of time for the whey protein isolate and olive oil tests are shown in Figure 1. As expected, olive oil showed no measurable impact on blood glucose at 40 g, or 350 kCal, consumed. Future experiments will look at whether it or similar oils can modulate the blood sugar response to ingredients that do impact blood sugar.
For whey protein, I observe an increase in blood glucose starting at ~45 min. and reaching a peak between 75-105 min. The magnitude increases with increasing amount consumed, but non-linearly; the difference between the 15 and 30 g consumed conditions is quite small. More data is needed at lower amounts consumed to see if this is a real effect or just noise in the data.
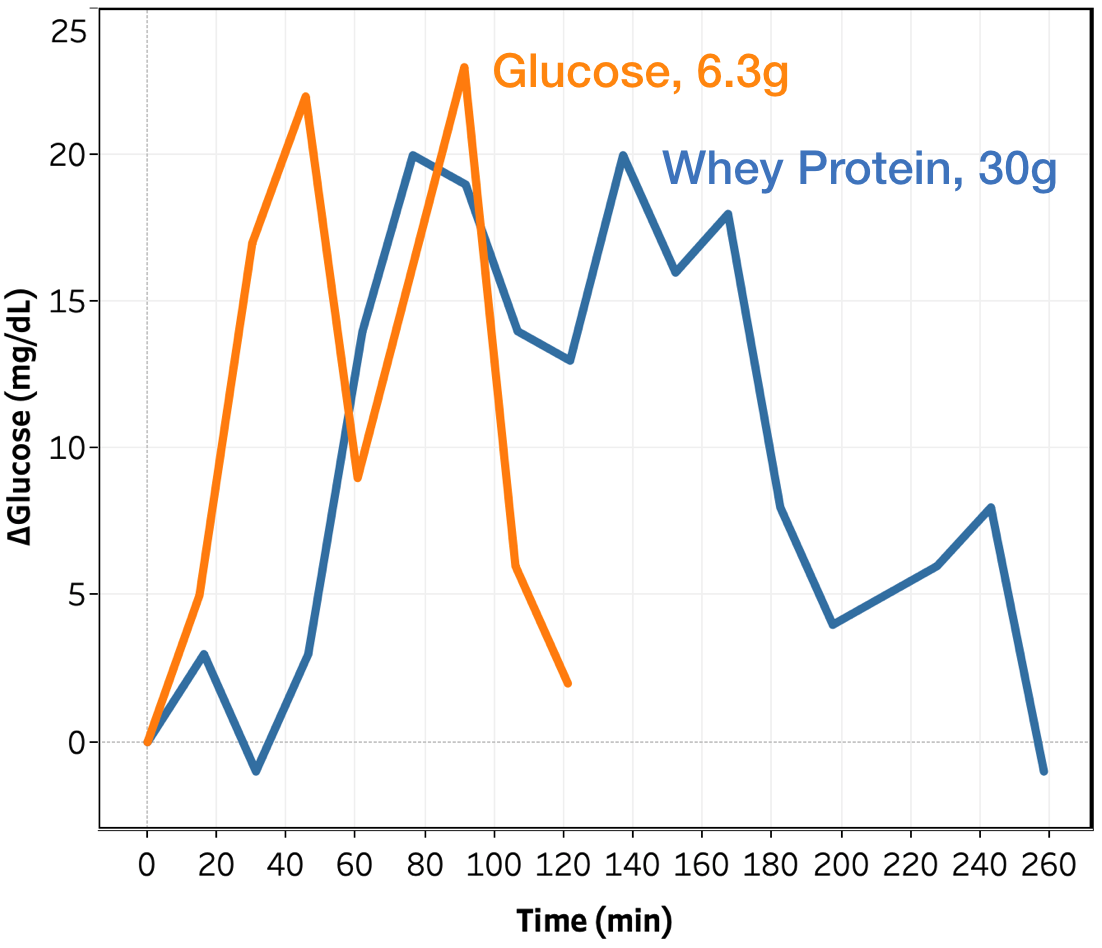
Comparing directly to glucose, for the same peak change in blood glucose, whey protein is much slower to impact my blood glucose and is metabolized over a much longer period of time. For example, looking at the conditions where peak Δmg/dL = 20-25 (see Figure 2):
- Time to >5 mg/dL rise is 60 vs. 15 min. for whey vs. glucose
- Time to return to <5 Δmg/dL is 255 vs. 120 min. for whey vs. glucose
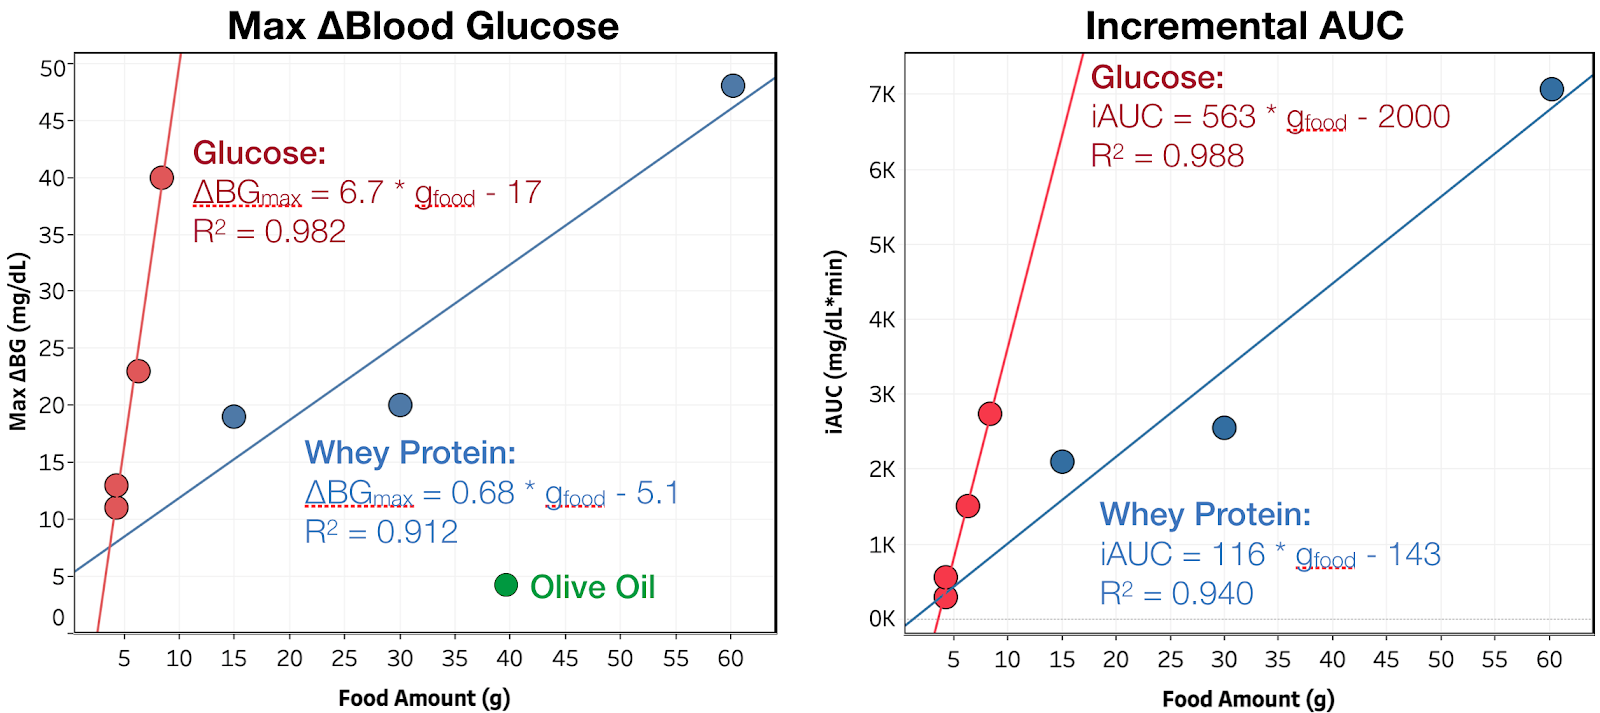
Results are similar for all other amounts consumed. As show in Figure 3 and the summary table, this slower metabolism results in whey protein having a larger relative impact on iAUC than peak change in blood glucose (20 vs. 10% of glucose per gram). This may be do to giving my body more time to produce endogenous insulin, or even directly stimulating its production, reducing the peak blood glucose. Both of these effects have been reported. Given that, it would be useful to see the same measurements in someone with Type 1 diabetes, who does not produce endogenous insulin.
Conclusion & Next Experiments
Olive oil had a negligible effect on my blood sugar, ~0.1 mg/dL/g(olive oil) for ~350 kcal of oil, or 1.5% that of glucose.
Whey protein isolate increases my blood sugar by ~20% that of glucose (by iAUC), but with a slower rise. This result sin a lower peak, 0.68 mg/dL/g(whey) or 10% that of glucose, but a long tail of increased blood sugar, ~0.4 mg/dL/g(whey) @ 4.5 h.
Still deciding what to try next week, but it will either be corn starch (to have an example from each major macronutrient), resistant starch (fiber with disputed claims to non-digestibility), or combinations of protein, fat, or fiber with sugar.
Could you try doing canned black beans or lentils? Supposedly they are remarkable for health outcomes.
Thanks for the suggestion! Both of those are pretty high carb (13g net/100 cal for black beans, 12g/100 cal for lentils), so I'd be pretty limited in the amount I could eat. I'm curious to try them, though, so see how their profile compares to the sum of the individual macros.