If I’m going to study how external stimuli affect blood glucose, the main measurement device I’ll be using will be a glucose meter (the one I have is the FreeStyle Freedom Lite). In order to understand the measurements I make, I’m going to need to know the accuracy and the precision of the device. By law, home blood glucose meters must give results that are within 20% of laboratory tests 95% of the time. That would mean that if someone’s blood glucose was 100 mg/dL, the meter could report 80-120 mg/dL. If that’s the kind of precision I’ll be getting, then I should just give up now. Fortunately, they’re a lot better than that.
Although there are a ton of studies on the accuracy and precision of blood glucose meters, I wanted to assess my specific meter under the conditions that I will be using it. To assess the accuracy, I measured the FreeStyle Control solution. To assess the precision, I measured my own blood glucose in sets of 5 measurements at different times over the course of the week (so that I’d have different glucose numbers).
Purpose
To evaluate the reproducibility of the FreeStyle Freedom Lite glucose meter under the conditions that will be used for subsequent experiments.
Design/Methods
General. All measurements were done using a FreeStyle Freedom Lite glucose meter and FreeStyle lancets & test strips. To reflect my normal usage, no special precautions were taken to clean the lancing site before measurement. To take a sample, the lancing devices was used to pierce the skin at an ~45 deg. angle from the finger. Blood was then squeezed out by running the thumb and pointer finger of the opposite hand from the first knuckle to the lancing site of the finger. Blood was then wicked into a test strip that had been inserted into the meter and the glucose reading was recorded.
Control solution test. FreeStyle control solution was purchased from Abbot on Amazon. Drops of solution were removed from the bottle according to the manufacturers instructions and tested using the procedure described above.
Blood tests. Sets of 5 blood samples were measured according to the procedure described above. The sample set was taken from either 5 locations on the same finger or the same location on 5 separate fingers over the course of ~1 min. Times were chosen to obtain a range of blood glucose values.
Data
Results & Discussion
Control Solution Tests. Unfortunately, commercial control solutions do not specify the exact glucose concentration, but instead only give a range of acceptable values that fall within the FDA’s +/-20% accuracy requirement (link, link). The Freestyle control solution kit I purchased came with two solutions, “High” and “Low”. My vial of test strips specifies the acceptable ranges of these solutions as 248-372 and 30-60 mg/dL, respectively. Assuming the ranges are centered on the actual value, that gives actual values of 310 mg/dL for “High” and 45 mg/dL for “Low.” I took 8 measurements of each control solution.
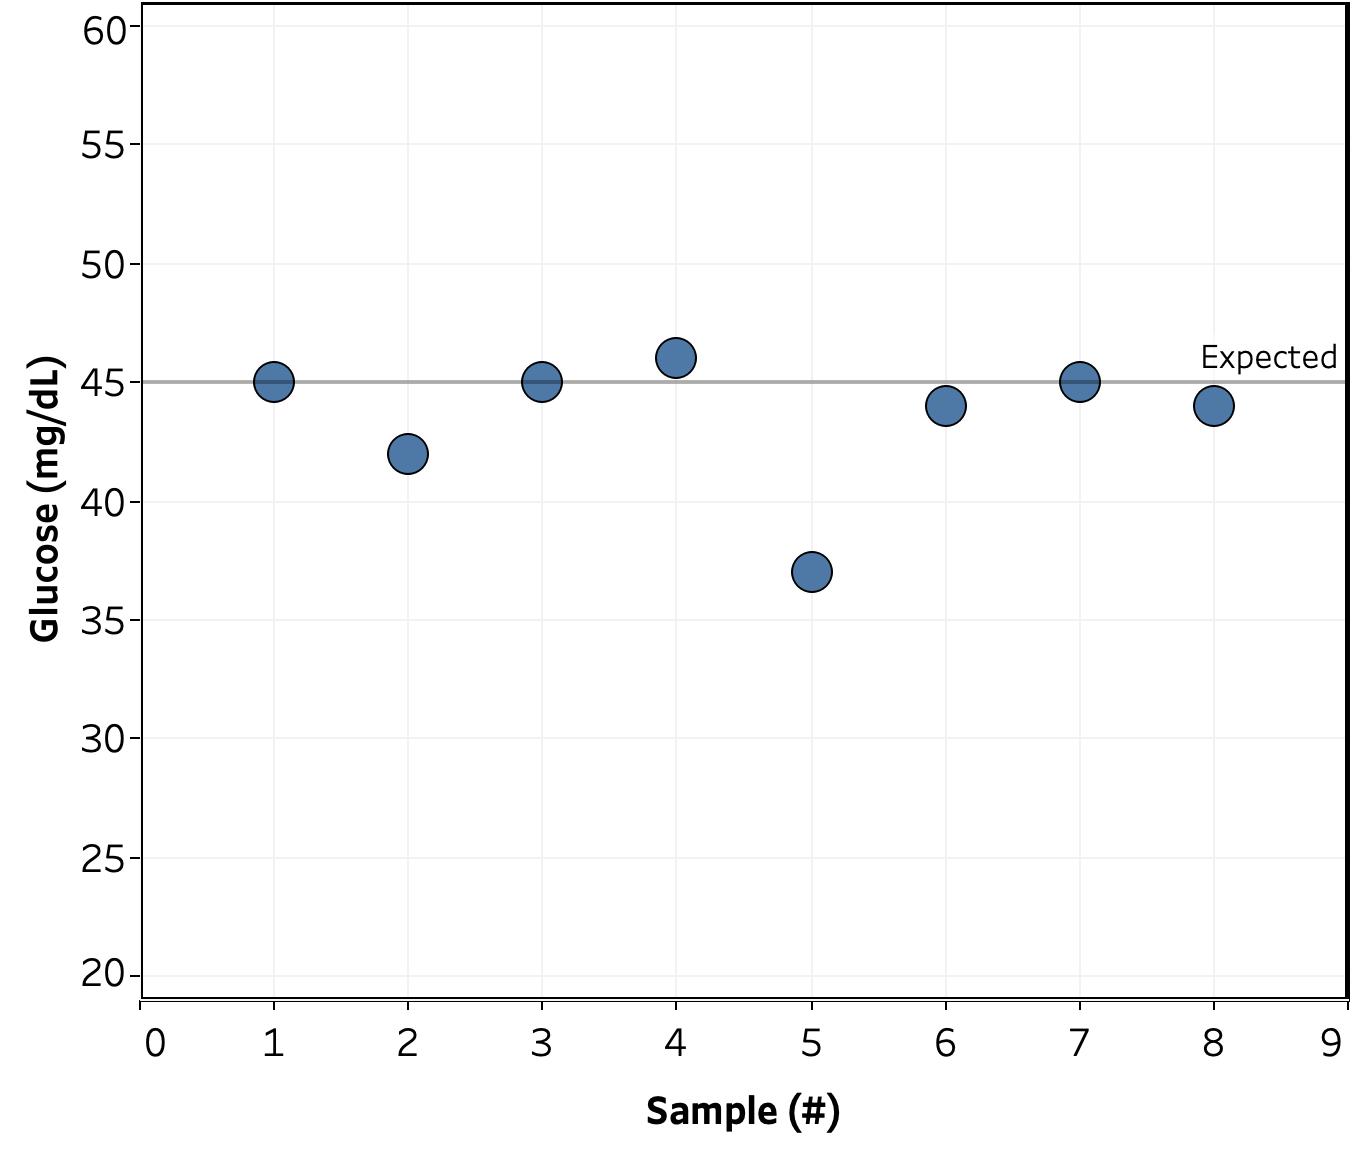
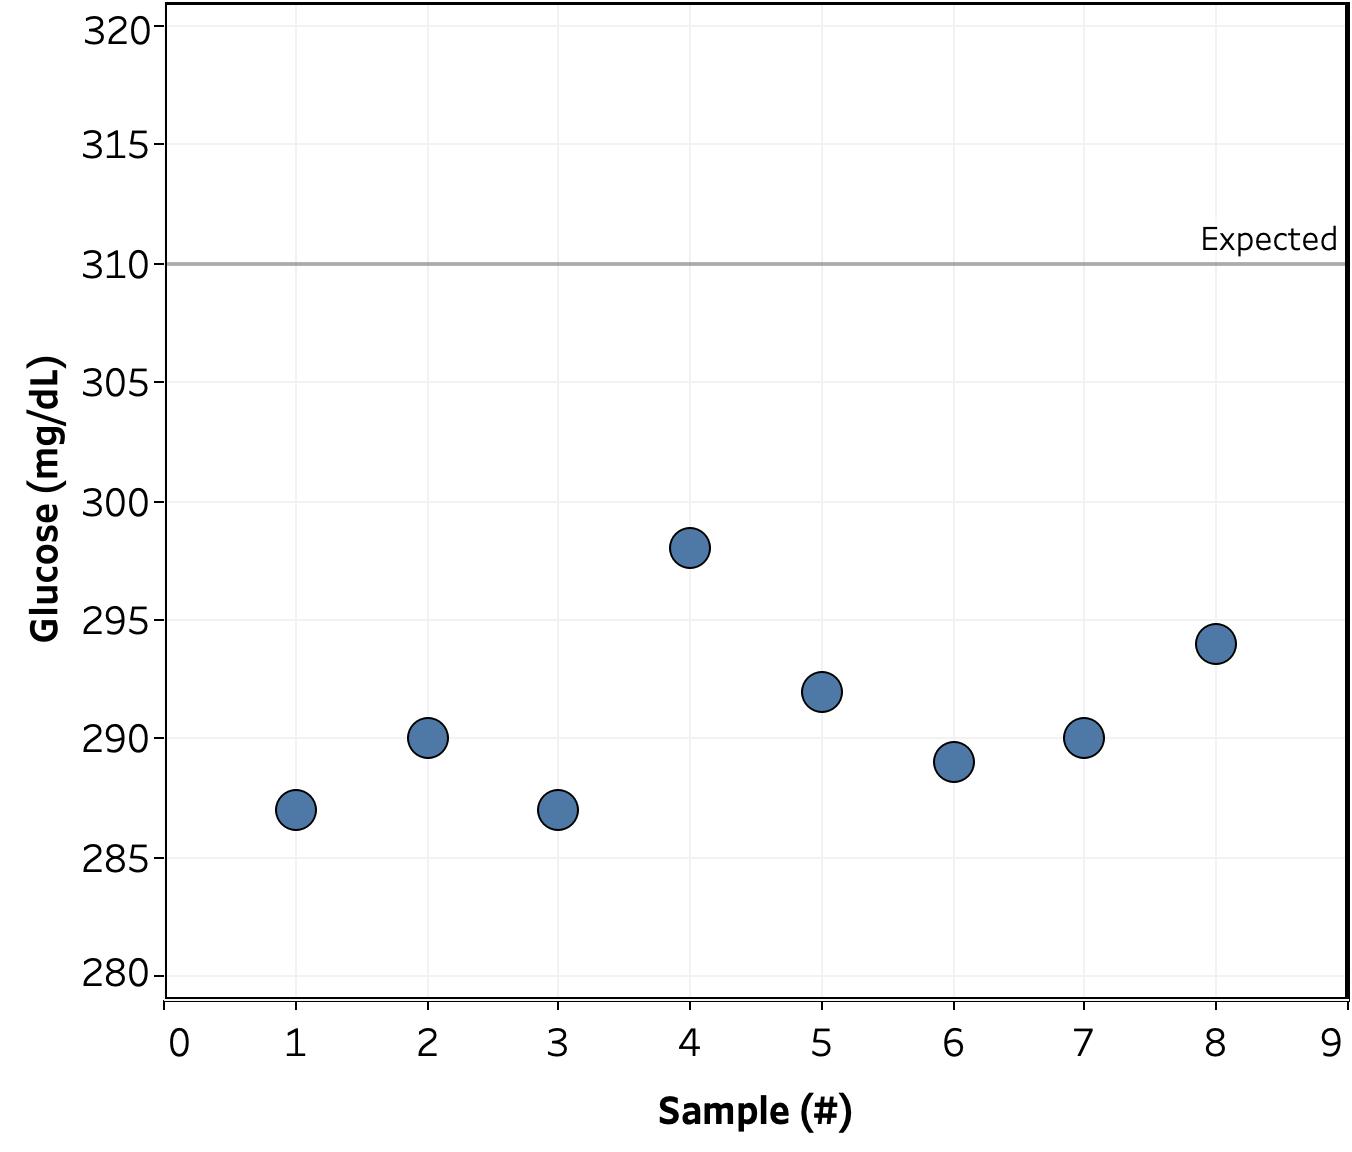
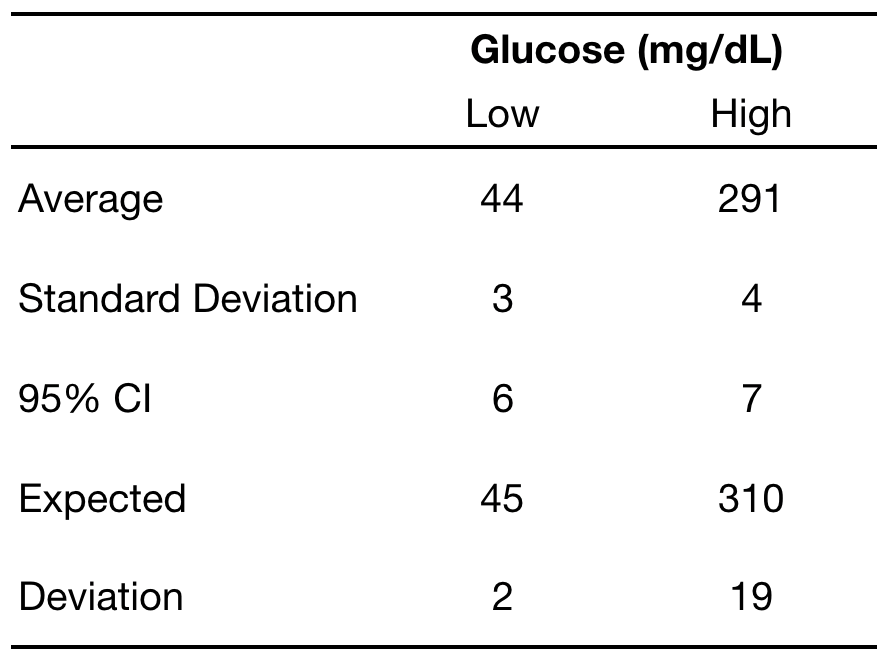
Happily, the readings were reasonably close to the expected value: 2 mg/dL (3%) for the “low” solution and 19 mg/dL (6%) for the “high”. The standard deviation and 95% confidence interval were more consistent between the two solutions at 3-4 & 6-7 mg/dL, respectively. As such, if a measurement were run repeatedly, I can expect it to fall between +/- 7 of the observed value 19 out of 20 times.
Blood tests. Next up was testing the accuracy of actual blood measurements. Shown below are the results of 11 sets of 5 measurements each taken over 7 days at different times of the day.
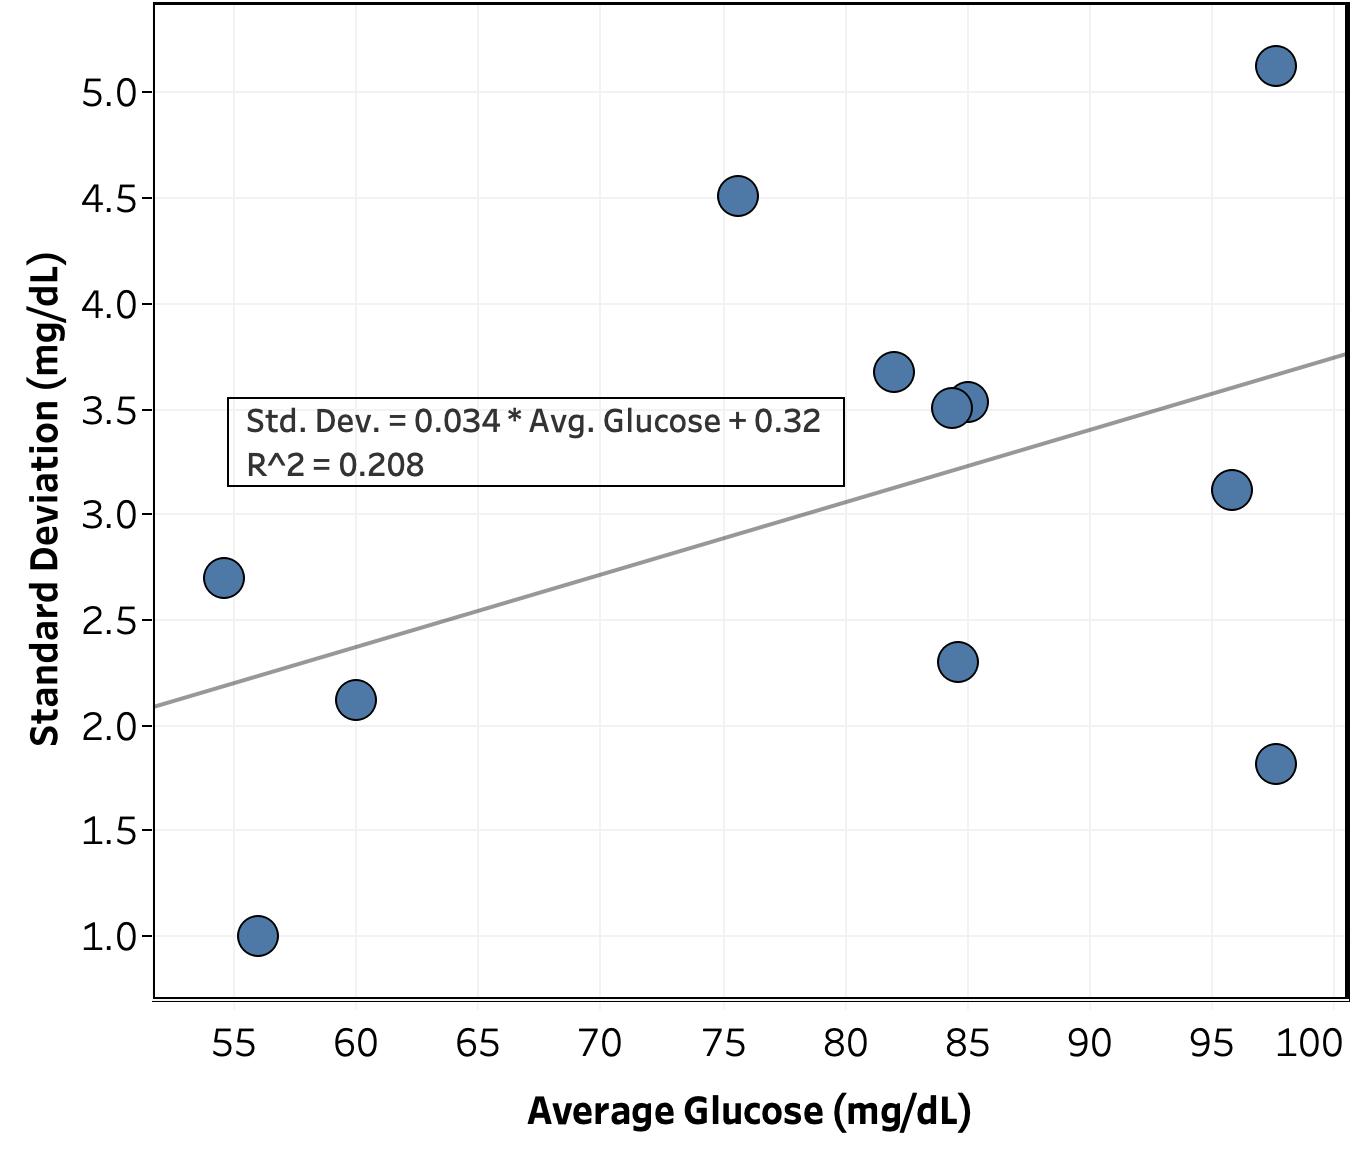
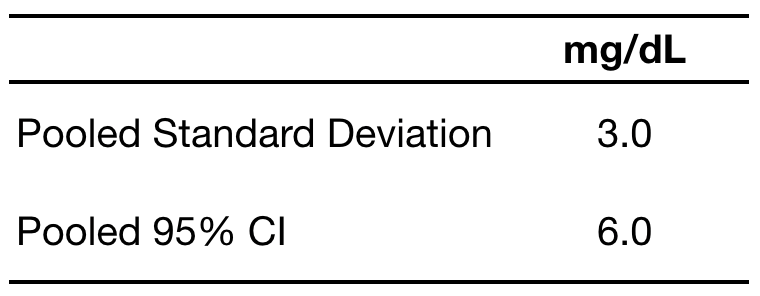
Surprisingly, the precision of the blood glucose measurements was just as good as those of the control solutions. Looking at Figure 2, there’s only a weak correlation between standard deviation and average glucose for a set of measurements (R^2 = 0.21). Given that, I was able to calculate a standard deviation for the whole data set (i.e. pooled standard deviation) of 3.0 mg/dL (95% CI = 6.0 mg/dL), nearly identical to that of the control measurements. This suggests that the variation in the measurements is coming from something in the meter, test strips, or external environment, rather than something in the blood.
Conclusions
A standard deviation of only 3 mg/dL blood glucose measurements should be good enough to measure the effect of different foods and other external stimuli or interventions. While there is a small correlation between the standard deviation and average glucose, it’s weak enough that 1) it may not be real and 2) I can ignore it for now.
Next Experiments
I’m always interested in ideas for new experiments, so please leave a comment if there’s something you’d like me to try.
- I will continue to measure the precision of the meter on a less frequent basis (sets of 5 measurements). Purpose is to:
- Get a better a more accurate measure of the correlation between standard deviation and average glucose
- See if there’s any trend in standard deviation with time, time of day, same vs. different fingers, etc.
- To ensure I’m not biasing the sample set by only taking measurements when I’m interested in the reading, I will randomize when I do a reproducibility measurement by rolling two ten-sided dieand taking a set of 5 measurements when the number is ≤ 2 (~2/week).
- For next week, I’ll start measuring how my blood glucose is affected by food and exercise.
- Getting a clean measurement for these is going to be tricky, as at any given time, there are a large number of factors affecting my blood glucose.
- To deal with this, I will pick standard times of day where external factors are as consistent as possible and then flip a coin to randomly decide whether to eat or exercise a fixed amount and then measure my blood sugar over time.
- It may take a while to get enough data to get reasonable statistics. If I don’t have enough data by next week, I’ll post an exploratory analysis of the initial data.
– QD
P.S. I’m sorry for the less than ideal graph/table arrangement on this post. I’m still getting a hang of blogger and I can’t figure out how to get two pictures to display next to one another.
Great work man you have post a great post it will help people very much keep it do more for people like that willguerard6aga.booklikes.com/post/2049146/become-a-trader-our-guide-to-achieving-your-goals.